Observations
L'Espoir se soutient
Un article sur l'espoir. Par Michael Gerson (journaliste, Washington Post).
Traduction: William O’Neill
“Opinion : Ce Noël, l'espoir peut sembler insaisissable.
Mais le désespoir n'est pas la réponse.

Beaucoup dans notre pays (et notre monde) ont perdu la simple confiance que des jours meilleurs sont à venir, pour diverses raisons compréhensibles. Il y a les fausses aubes du coronavirus, suivies de nouvelles peurs. Il y a des prix en hausse et des étagères vides, comme en Roumanie soviétique. Il y a l'Afghanistan, en train de sombrer dans une catastrophe causée par l'homme. Il y a une augmentation de la violence urbaine. Et une injustice raciale profondément ancrée. Et un environnement qui flambe et qui fond sous des tensions terribles. Tout semble crier en chœur chaotique : «les choses ne s'améliorent pas ».
Cet esprit possède notre politique. La droite voit un pays en déclin culturel, dépouillé de son identité et de ses valeurs. La gauche craint que nous nous dirigeions vers un nouvel autoritarisme. Les deux sont des idéologies de perte prophétisée. Dans une société, de tels ressentiments deviennent facilement septiques. Tant de gens autrement iréniques semblent capturés par la politique du poing fermé. Une partie semble sincèrement souhaiter à certains de leurs voisins l'humiliation et le mal.
«Vous avez décidé de ne pas vous faire vacciner? Pas de problème pour moi. Dépêchez-vous et mourez sans épuiser mes ressources».
Dans de telles circonstances, il peut sembler impossible de maintenir l'espoir.
Pourtant, dès le plus jeune âge, si nous avons de la chance, on nous apprend que l'espoir se soutient. C'est l'une des assurances les plus fondamentales de l'enfance pour un parent de se pencher et de dire à un enfant qui pleure : «tout va bien. Tout ira mieux». Nous avons un désir précoce et instinctif de savoir que les épreuves sont temporaires, que les blessures vont guérir et que tout ira bien à la fin. Lorsqu'un agresseur d'enfants viole une telle promesse, c'est la trahison la plus cruelle possible. Lorsque les jeunes et les adultes perdent confiance en la possibilité d'un jour meilleur, cela peut entraîner les maladies et les ravages du désespoir : toxicomanie menant à une overdose, alcoolisme menant à une insuffisance hépatique, ou accident de la route évitable, dépression menant au suicide.
Un chroniqueur vivant à travers une illustration de colonne appropriée devrait probablement la divulguer. Je suis aux prises avec le cancer depuis longtemps. Pendant la majeure partie de cette période, le cancer a essayé de me tuer sans que je le sente. C'était interne et théorique. Maintenant, j'ai atteint une phase différente et désagréable, dans laquelle le cancer essaie de me tuer et de me le faire ressentir - la phase où les projets de vie se dénouent et les gens que vous aimez vous regardent faiblir.
Je ne suis pas près de la mort et je ne prévois pas de l'être bientôt. Mais il y a un moment dans l'évolution d'une maladie comme la mienne où tu crois que tu vas guérir, que tu vas aller mieux. Et j'ai dépassé le point où cet espoir est crédible. Maintenant, Dieu ou le destin a parlé. Et les mots claquent comme des portes de fer : Non, ça ne va pas. Vous n'irez pas mieux.
De telles réflexions découlent naturellement lorsque vous écrivez depuis le domaine des merveilles antiseptiques de l'hôpital pendant des «vacances». Mais presque chaque vie implique finalement de tels tests d'espoir. Certaines questions, même non urgentes, sont universelles : Comment donner un sens à une souffrance aveugle et stupide ? Comment vivons-nous avec un but au milieu d'événements qui crient au hasard injuste ? Qu'est-ce qui soutient l'espoir quand il y a peu de raisons pour cela ?
Le contexte de l'histoire de la Nativité est un espoir mal compris. Les prophètes et le peuple juif ont attendu pendant des siècles dans une attente défiante que le Messie délivre Israël de l'exil et de ses ennemis. C'était essentiellement la croyance incarnée que quelque chose de différent et de meilleur était possible - qu'une intervention divine capitale pouvait tout changer.
Mais l'événement tant attendu est arrivé sous une forme tout à fait inattendue. Non pas comme le triomphe de la politique et du pouvoir, mais dans une humilité et une vulnérabilité choquantes. Le désir du monde chez un nourrisson qui vomit son lait. Chœurs angéliques se produisant pour des personnes sans aucun compte social. Un aperçu de la gloire entourrée par l'odeur de la bouse animale. De toute évidence, nous sommes invités par cette sainte intrigue à suspendre un instant notre incrédulité et à envisager une révision révolutionnaire de la vérité spirituelle.
Vous n'avez pas besoin d'être un "croyant" pour toucher au côté spirituel de l'être humain. Si vous ne croyez pas qu'il y a un côté spirituel de votre existence, alors votre vie est certainement inutilement dure et incomplète.
Ou du moins c'est ce que dit l'histoire de cette naissance, que nous essayons d'interpréter sous des textes limités, voire conflictuels. Peu importe comment nous réagissons à l'historicité de chaque élément, cependant, la Nativité présente la réalité intérieure de la venue de Dieu.
C'est un Dieu qui fait des efforts ridicules pour nous chercher.
C'est un Dieu qui a choisi la voie basse : la puissance dans l'humilité ; la force s'est perfectionnée dans la faiblesse ; le dernier sera le premier ; bienheureux sont les moindres d'entre eux.
C'est un Dieu qui était vêtu de sang et d'os et destiné à la souffrance humaine - qu'il n'essaie pas de nous expliquer, mais simplement de la partager. C'est peut-être le plus difficile à comprendre : l'étonnante vulnérabilité de Dieu. La plupart des sociétés du passé le décrivaient comme tout sauf vulnérable. Toujours vêtu d'une force ultime. Peut-être plus un désir et un besoin humains que la vérité.
Et c'est un Dieu d'espérance, qui offre un autre type de sécurité que la réalisation de nos souhaits les plus profonds. Il promet une transformation du cœur dans laquelle nous libérons le fardeau de nos désirs et vivons dans l'attente des desseins de Dieu, jusqu'à ce que toutes ses miséricordes soient révélées.
Il y a un nombre presque infini de manières autres que les choeurs angéliques par lesquelles Dieu annonce sa venue. J'ai des amis qui ont connu un coup de foudre de mission indéniable, ou qui voient Dieu dans la beauté profonde de la nature, ou connaissent Jésus au service des dépossédés: tirant un migrant d'une vague d'eau sombre et mortelle.
Pour moi, de telles assurances ne viennent pas facilement ou souvent. Les miens sont moins grandioses qu'un bref aperçu derrière un rideau. Dans le poème de Sylvia Plath « Black Rook in Rainy Weather », (Un "rook" est un oiseau sombre ressemblant à un corbeau, rendu plus triste par son apparence par temps de pluie), elle a parlé d'une lumière « incandescente » qui peut posséder « les objets les plus obtus » et « accorder / Un bref répit de la peur ». Plath conclut : « Des miracles se produisent, / Si vous voulez bien appeler ces spasmodiques / Trucs de miracles radieux. L'attente a recommencé, / La longue attente de l'ange. / Pour cette descente rare et aléatoire ».
L'espoir de Noël pourrait bien tomber dans la catégorie psychologique de la réalisation de souhaits. Imaginer des choses dont nous pensons avoir désespérément besoin ou envie. Mais cela ne réfute pas la possibilité de souhaits réellement exaucés.
À Noël, nous considérons la preuve éclatante et désorientante que l'espoir l'emporte. Si c'est vrai, c'est une histoire qui peut réorienter chaque histoire humaine. Si l'on choisit de permettre cela. Permettre au changement, une place dans sa vie. Cela signifie que Dieu est avec nous, même dans la souffrance. C'est l'assurance, comme d'un parent, comme d'un ange, comme d'un sauveur : C'est bien. Et même à l'extrême de la mort (citant Julien de Norwich à ce moment) : « Tout ira bien, et toutes sortes de choses iront bien ».
---------------
l'Espoir? Ils oublient souvent de le mentionner au Journal Télévisé.
---------------
ou en Microsoft WORD (*.doc)
Let's widen our perceptions
CoronaSTAVELOT.com
Thanks for visiting!
To translate this page, select your
language from the dropdown menu below:
Servez-vous du traducteur ci-dessus si besoin.
If you hadn't noticed, the COVID-19 pandemic is still going on.
Let's backtrack to a key point in the lessons that most have now mastered.
The experts said: (paraphrased) "If the vaccines are going to stop this virus, a level of herd immunity of 60 to 70% in a population will have to be reached."
And where are we now?
Well, where would you like to look? Very, very locally, or at the world?
Evolving a pandemia-related type of tunnel vision, helps one to make it calmly through the day.
Locally where I am (in Belgium) things look like this ...
The vaccinations in one city are sorted below by age groups.
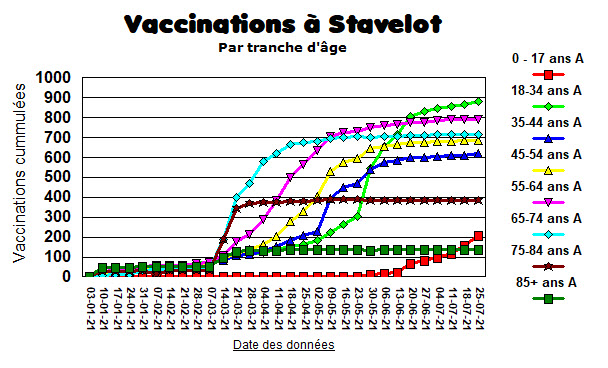
So, a slow start back in January. A push to get the elderly vaccinated by end of March, (the flat lines above mean not a lot of recent vaccinations for that subgroup). Vaccination of those 18 to 24 years picking up towards end of May. Children and adolescents starting at end of June, but still a small percentage of the total.
One can move out just a bit further to compare different regions of Belgium with this same city, where 58% of the citizens have full vaccine coverage.
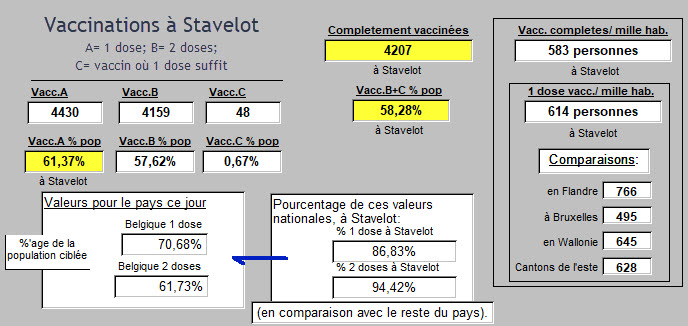
And out of these comparisons, a correct impression arises that this city's performance is not the best result when compared with other regions, but not bad.
Progress is being made.
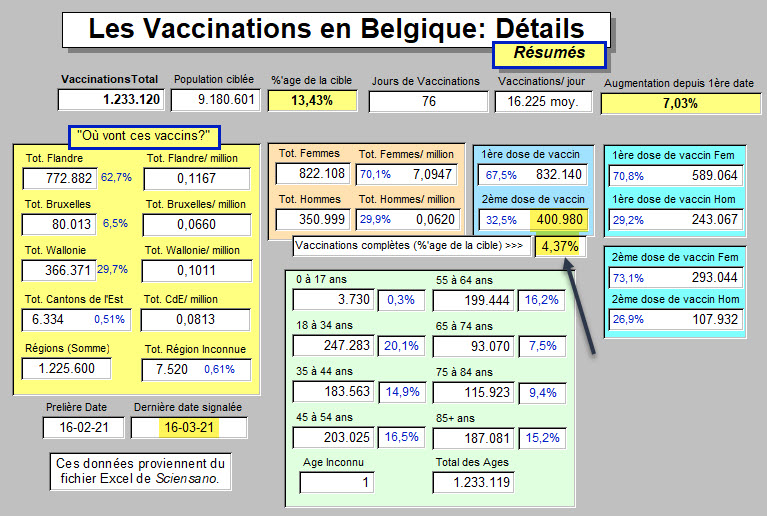
A target in Belgium had been set at vaccinating with at least one dose 9 180 601 Belgians of 18 years and older. (Belgium's population is just over 11.46 million inhabitants).
That goal was met. 14,870,000 doses have been administered, or 162% of that target. At present, an average of 45,419 vaccinations are administered each day here in Belgium.
Is that enough? Was that initial target meanigful? Has it stopped the virus in Belgium?
Is vaccination getting the job done? If answered for the local data here, it is also a meanigful question to be posed throughout the world. Vaccination has been thought of by many as a global "off-switch." That is likely to be proved wrong. That vaccination by itself will not be enough seems to be an increasingly supported theme.
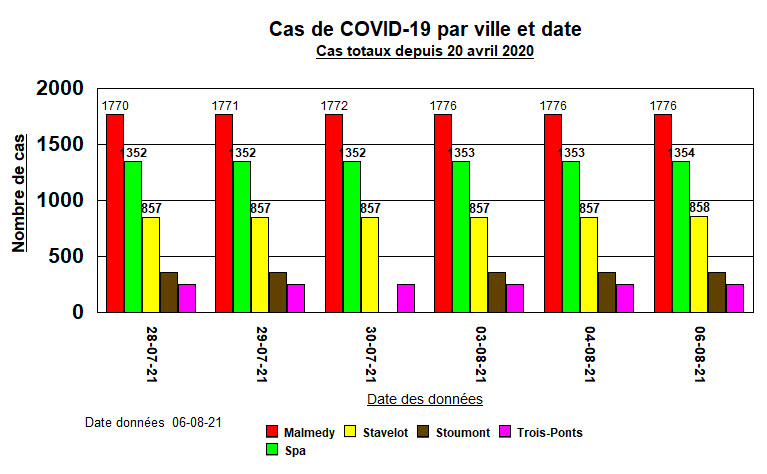
Locally in 13 cities near the one just presented, cases continue to creep up, very, very slowly.
None of these local towns have found a way to make the numbers stop growing. Slowly growing at present, but not stopped. Here are 5 of these towns, showing numbers of total cases since late July.
If the experts reappeared, they might quietly remind that 58% vaccinated is not 70%.
But is that local perspective, like using a magnifying glass, the right one?
The above city is located in the Province of Liège.
There, the incidence of COVID-19 is currently 12,133.6 cases per 100,000 inhabitants.
And that today, presents a slight but constant increase in daily incidence figures over the last weeks.
Incidence involves defining a period of observation. So an image of walking around with a clipboard for a week and counting all the cases one could find is not too far off as explanations go. Could be reported for a year or other selected interval of observation as well. Once one has a method down, it can be applied to comparisons.
Just to the east in Luxembourg it's 11,863.39 per 100,000. A bit further to the east in the Rhineland of Germany, its 3,876.48 per 100,000.
Are those incidence results due to important differences in management by Public Health sectors of government? How much is policy? How much is public behavior?
In Algeria the incidence is 405.95 per 100,000 inhabitants.
In Ghana its 342.53 per 100K.
In Somalia, 99.0 per 100K.
Are those good numbers from a perspective of reporting accuracy? Can we believe them?
Hard to say. They are from the same source.
Not clearly related perhaps, Luxembourg has the highest GDP-PPP$ rating in the world, ranked number 1 at 118,001$.
Somalia is near the bottom of the list, ranked number 192 at 923$.
Luxembourg's COVID-19 incidence rate is 120 times higher than that of Somalia.
Bad numbers? Or does the ability to pay for vaccines for one's population not solve the problem?
Clearly, as many European countries prepare to decide about a third dose of vaccine for their inhabitants, (Israel and Germany have already started) many countries that are ranked lower on the income ladder have yet to start.
Here are those global vaccination data today:
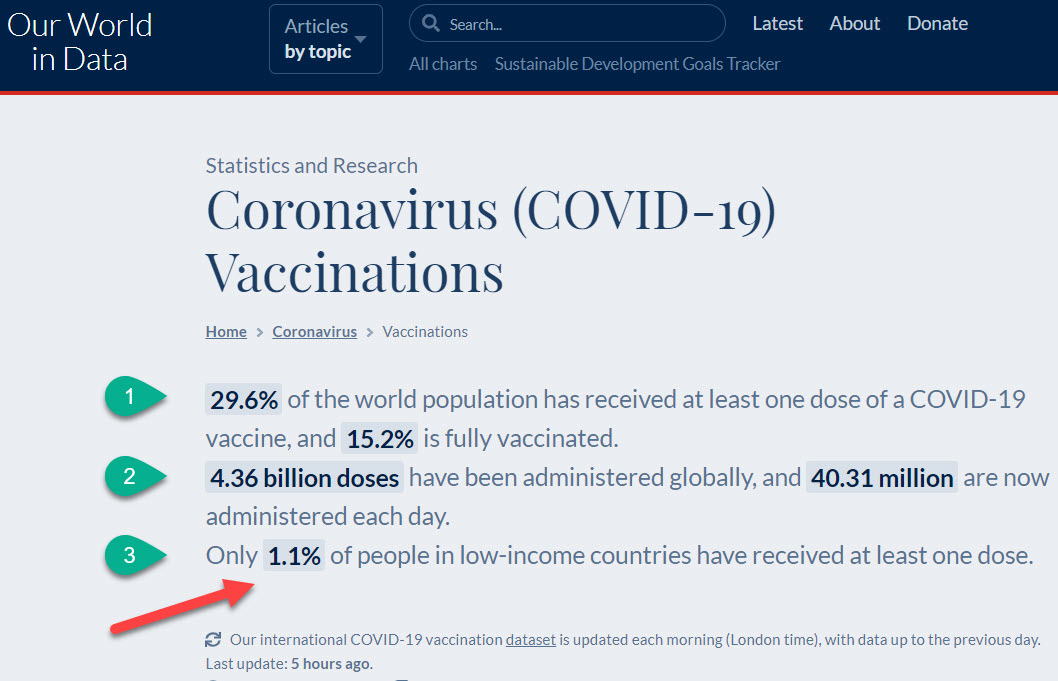
At #1: 29.6% and 15.2% as presented, based on the target proposed by the experts, means that at a World level, we're not even close to 60 or 70%.
At #2: The vaccination numbers sound huge. They are huge: 4.4 billion of anything is huge.
40 million people vaccinated each day is huge. So it's easy to form a mental image that we'll be done soon.
At #3: Yet another worldly maldistribution problem appears. "1.1% of people in low-income countries have received at least one dose."
1.1% of anything seems very small. Of course, multiply out 1.1% of these populations, add them up, and it's lots of people.
Which are the "low-income countries"? How many of them are there?
Well, those who count such things find about 24 countries where average median per capita income is below a line drawn at 3.571 thousand.

Such data can be found here, from the International Monetary Fund. Or here in PDF in a quite complete document.
Such data might also quickly lead this article into a sticky discussion of what is fair in the business of world vaccination distribution and availability. Finding "fair" may be one approach. Finding "possible" means something else.
Let's once again retreat just a moment to a more local perspective.
In Belgium today, total numbers, 1 134 907 cases of COVID-19. Responsible for 25 264 Deaths.
With 1 062 447 who were infected, now counted as Recovered.
That leaves 47 196 Actively Ill with COVID-19 today in Belgium. In 47 104 cases (99.8%), a mild illness, and at present, 92 (0.2%) serious or critical.
Being ignored completely in those figures is the difference between counted cases (positive tests) and number infected and loose in the streets available for further transmission of the virus. (Ten to 12 times the other number).
Since we mentioned the subgroups of those Actively iLL and Recovered, the ratio of the two in the reported cases for the world looks like this recently:
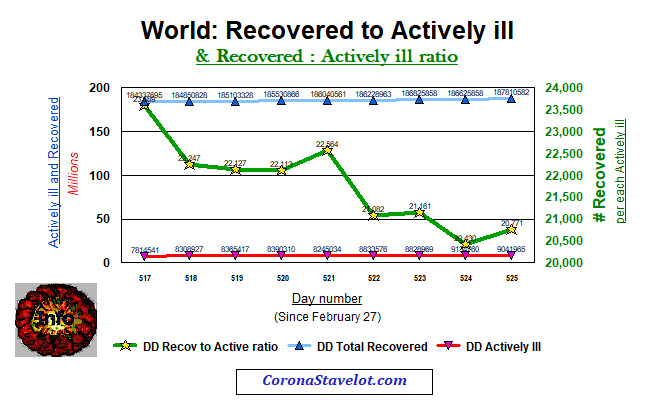
Simply put (as shown by the green line above) there are about 21 individuals who were sick who have now recovered, for each individual who is currently still Actively iLL. Certainly, that's good news, though the trend is currently downwards.
Those numbers may lean us towards a conclusion that the vaccination effort is effective and that the battle is being won. Maybe its the vaccine. It's probably a combined effect of several other things as well.
It remains that nothing in this COVID-19 situation today is free from uncertainty.
Uncertainty has become the by-word for daily existence. Let's look at this below:
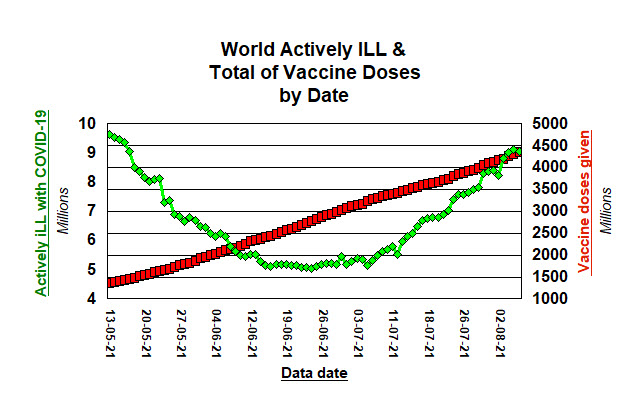
Going back to mid-May, about 1.5 billion doses of vaccine given (right side of the graph, in red).
Cases of Actively iLL (in green, left side) trended downwards, and bottoming at end of June.
But since? As the big numbers for vaccination methodically rose (to almost 4.5 billion today),
so did the millions of individuals Actively iLL with COVID-19.
Why?
The experts would safely suggest that 15.2% fully vaccinated in our world isn't 70%.
Some of them might remind that this pandemic all began with just a relatively small (by comparison with today) number of cases. We have been living all those scary geometric-growth-in-transmission numbers right from the start. And each time that a downward slope seems to bottom out to give us hope, an upward trend has unfortunately begun once again and all to soon.
The experts might summarize : "... still need to get more people vaccinated."
So who isn't vaccinated?
Yes, there are the anti-vaxers and those who have been stalling to see who would drop dead from brain clots or get Guillain-Barré after the jab of Astra-Zeneca or any other vaccine.
As the well-to-do-countries winnow their way towards a third dose of vaccine, (you'll find them at the top of this list), the folks at the bottom of that list just don't seem to want to go away as the problem of non-vaccination gets analyzed and summarized.
One can approach that problem with discussions about countries that are in red zones or lighter shades of pink. One can carefully incorporate daily changing recommendations for travel, into a planned and sorely needed vacation. One can even start discussions and reactions to, about whether we should be making efforts to get someone in Somalia vaccinated, when that person might just be a Somali pirate. Perhaps the close friend of a murdering dictator in some other "low-income" country is awaiting a vaccine as well.
That's not it.
One can feel pushed to act fast by reports from those on the medical front line that this Delta-variant illness is once again, ... a source of important uncertainties. Those catching the thing and getting quite sick at times, seem to be the "younger, sicker, quicker" to decompensate group of patients. We have mastered saving all the elderly in Nursing Homes. It's not them anymore.
Do we just need to learn a little bit more about all of this?
More armchair epidemiologists needed? Is that it?
Let's take a break for a little video ...
(You can leave your PC's sound on, this video is silent).
This comes from a great page that you can find here at Worldometer.
I'll show my bias right off the bat, but let's pick one activity that has replaced music lessons or playing chess.
Spent on Video Games TODAY : 225 668 712 million dollars. Today.
A dose of AstraZeneca vaccine here in Belgium sells for 1.78€ (2.093$US).
So a day's worth of Video Games buys: 107.820.694 doses of AstraZeneca vaccine (assuming the same price as just given).
Population of Somalia? 16 375 690.
(16 375 690 x 2) = 32 751 380
A day's worth of Video Games fully vaccinates everyone in Somalia, and leaves 75 069 314 doses for some of the other "low-income" countries.
I can hear it already: "You're going to ask me to give up buying a Video Game so somebody can vaccinate a Somali pirate ? !"
Answer: "Yup. We'll vaccinate the bastard."
Why would one do that?
Well, if one is only interested in protecting one's own health, so that the downstream contacts of that Somali pirate, don't bring the virus to your home for your end-of-year Holidays.
Look again at that little one minute video above. Notice what is now occupying our social existence. Think about what occupied our existence and those of our parents about 50 or so years ago. Even more recently.
How many times did you check your eMail today?
Our world has changed.
But if we want to keep it, now is the time to think our way out of this box, face the uncertainties, create possibilities, and get a move on.
Or we can wait to see which of the Ten Plagues reappears next. We've had Mad Cow Disease, a need to destroy Minks in Denmark, Fires and Floods, and Locusts, and we've got the Pandemic now. What's next?
It's time to start dreaming a way out, that includes others besides ourselves.
Les données sont bonnes, ou pas?
CoronaSTAVELOT.com
Thanks for visiting!
To translate this page, select your
language from the dropdown menu below:
Servez-vous du traducteur ci-dessus si vous préférez lire en français ( ou d'autres langues! )
When public health publishes it's most recent data, are these quite independent, or are new values simply fitting in to a repeating pattern?
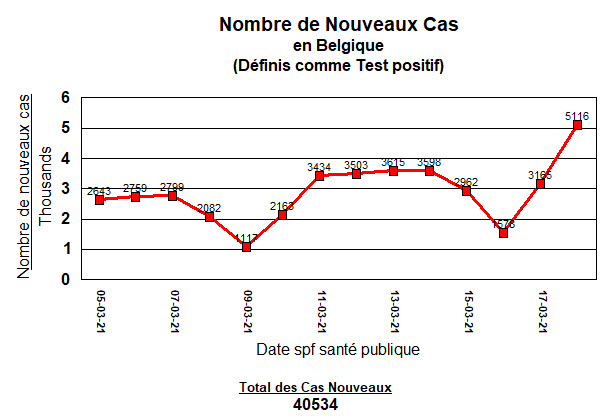
Here are values for the past 10 days: new cases of COVID-19 announced in Belgium.
So today's announced cases are higher.
Time to sell the farm and move to antarctica, or not yet?
But is there a pattern here?
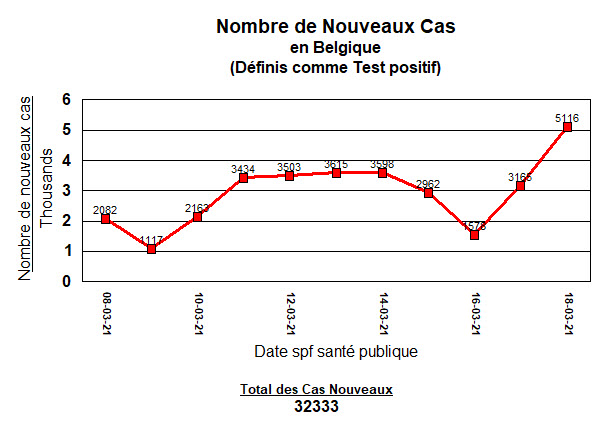
Let's look at the last 14 days ...
Those two low points are both Tuesdays. Does that mean anything?
Let's look at 30 days ...

Once again, all the low points are Tuesday's. And Thurdays, Fridays, Saturdays, the high points.
Then it starts over.
Clearly, the virus is checking its calendar before infecting people.
Here's a bit more. Though the point is already made visually.
Covid-19 positive tests (or cases) repeat on a weekly basis. Here's 60 days:
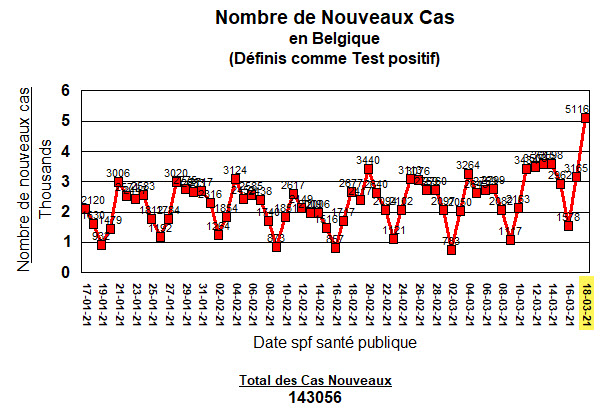
It's hard to miss the pattern. And yes, that last day is higher. I'll come back to that.
And yes, if you put a ruler across that, cases are and have been increasing.

What is the cause of this repeating pattern?
If it's not the virus with a calendar (that it doesn't have), what is it?
Some have suggested sociological factors.
People go back to work on Monday, and then cases star to rise.
They like to get together on the weekend.
Or perhaps, the habits of the country's medical system.
You call your doctor during the weekend and get the covering physician. You are told to wait until Monday. You call Monday, and get an appointment for Tuesday. ... things like that.
It actually has more to do with how your case (if you get infected) will be added to the numbers and reported by Public Health (Sciensano).
Notice that once more: it's not the virus, nor what happens with schools and at work, it's the reporting habits of Public Health. It is seen in other countries as well. Some have suggested it represents a case reporting system that is unstable.
Here below I'll quote from the experts.
These are at the American Society for Microbiology.
"Ups and Downs in COVID-19 Data may be Caused by Data Reporting Practices
- COVID-19 case and death data show regular oscillations
- New analysis of national and local numbers attributes those oscillations to data reporting practices
- Findings suggest epidemiological models should account for problems with diagnosis and reporting
Washington, DC – July 14, 2020 – As data accumulates on COVID-19 cases and deaths, researchers have observed patterns of peaks and valleys that repeat on a near-weekly basis. But understanding what's driving those patterns has remained an open question.
A study published this week in mSystems reports that those oscillations arise from variations in testing practices and data reporting, rather than from societal practices around how people are infected or treated. The findings suggest that epidemiological models of infectious disease should take problems with diagnosis and reporting into account.
“The practice of acquiring data is as important at times as the data itself,” said computational biologist Aviv Bergman, Ph.D., at the Albert Einstein College of Medicine in New York City, and microbiologist Arturo Casadevall, M.D., Ph.D., at the Johns Hopkins Bloomberg School of Public Health in Baltimore, Maryland. Bergman and Casadevall worked on the study with Yehonatan Sella, Ph.D., at Albert Einstein, and physician-scientist Peter Agre, Ph.D., at Johns Hopkins.
The study began when Agre, who co-won the 2003 Nobel Prize in Chemistry, noticed that precise weekly fluctuations in the data were clearly linked to the day of the week. “We became very suspicious,” said Bergman.
The researchers collected the total number of daily tests, positive tests, and deaths in U.S. national data over 161 days, from January through the end of June. They also collected New York City-specific data and Los Angeles-specific data from early March through late June. To better understand the oscillating patterns, they conducted a power spectrum analysis, which is a methodology for identifying different frequencies within a signal. (It’s often used in signal and image processing, but the authors believe the new work represents the first application to epidemiological data.)
The analysis pointed to a 7-day cycle in the rise and fall of national new cases, and 6.8-day and 6.9-day cycles in New York City and Los Angeles, respectively. Those oscillations are reflected in analyses that have found, for example, that the mortality rate is higher at the end of the week or on the weekend.
Alarmed by the consistency of the signal, the researchers looked for an explanation. They reported that an increase in social gatherings on the weekends was likely not a factor, since the time from exposure to the coronavirus to showing symptoms can range from 4-14 days. Previous analyses have also suggested that patients receive lower-quality care later in the week, but the new analysis didn’t support that hypothesis.
The researchers then examined reporting practices. Some areas, like New York City and Los Angeles, report deaths according to when the individual died. But national data publishes deaths according to when the death was reported—not when it occurred. In large datasets that report the date of death, rather than the date of the report, the apparent oscillations vanish. Similar discrepancies in case reporting explained the oscillations found in new case data.
The researchers emphasized that no connection exists between the number of tests and the number of cases, and that unless data reporting practices change, the oscillations will remain. “And as long as there are infected people, these oscillations, due to fluctuations in the number of tests administered and reporting, will always be observed,” said Bergman, “even if the number of cases drops.”
So what?
In case you missed it, what the experts just told us is that it is not the virus, it's not our social habits, it's not our health care system, ... but it is the way in which cases or test results are acquired and reported.
It also suggests a reporting system with a fair amount of instability: Too much variability in how data comes in, and how the quality of those data are controlled.
WIthout wanting to make this article too much longer, we recently saw (2 days ago) how 86 deaths and 10 or so resuscitated dead were added to the death count (or removed from it). These death events were as far back as last March 18, 2020. No one at Sciensano mentioned that all of these errors in reporting, every one, happened in Flanders. A year to straighten out the numbers! Disgraceful!
The number of positive cases that can't be assigned to one of the three regions of Belgium, continues to increase. (A total of 15 337 in that category today).
Also another sign of increasing instability in the counting process.
So what?
Well, when cases are at their lowest on a Tuesday, and the government begins talking about re-opening resaurants and schools: Ignore what they say.
And on a Thursday, like today, when the cases hit what looks like a new high, which the media will scream at full volume, and the government steps forward to tighten the screws: Ignore what they say.
It won't make a difference.
Let's look quickly at today's result with a few statistical tools.
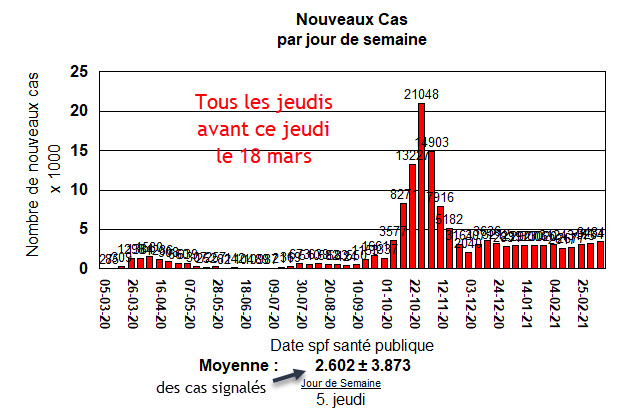
The average number of reported cases on Thursdays before today is 2 602 cases announced.
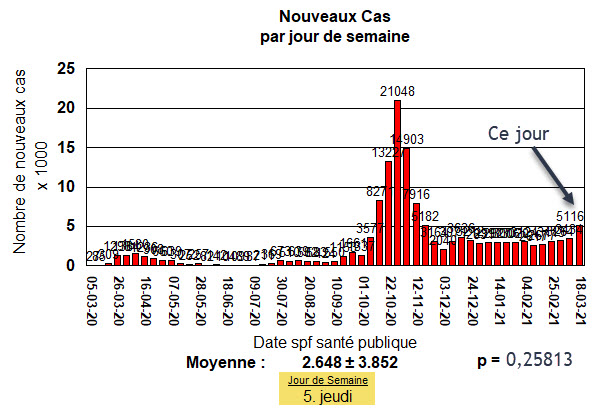
Here is today's addition of these announced cases:
Here are some statistical tools (a Z Score and it's p-value) which tell us something:
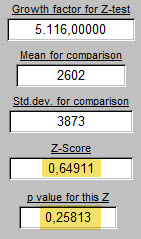

On the left above, today's 5116 cases (or positive tests) compared with the average for all the Thursdays that came before (2602 ± 3873). The Z score is a weak 0,65. The p-value says that there are 26 chances out of 100 that today's 5116 is different from the average Thursday. Statisticians say that's too high a rate of chance to accept. We'll see.
On the right, the rate of growth since yesterday (1,61642 at arrow number one) is compared at arrow number two with the average rate of growth for previous Thursdays (1,585 ± 0,441). So are present rates of viral transmission different than previously? There are 94 chances out of 100 that there is no difference: That we have seen this level of cases reported on a Thursday before.
Whatever has been done in Belgium, since the start of the pandemic, has not succeeded in reducing growth and transmission of the virus to zero. I did not say that wearing a mask, handwashing, reducing the number of contacts, etc., had no effect. Without these, cases would have certainly skyrocketed. But it has not been able to get the Belgian population to where it wants to be: no coronavirus cases. Experts will reply that that target, that challenge, is simply unobtainable. To pursue that discussion is simply more time wasting.
Why don't people see these chages, and react?
Because the changes are typically too subtle.
Day after day, only a few more cases.
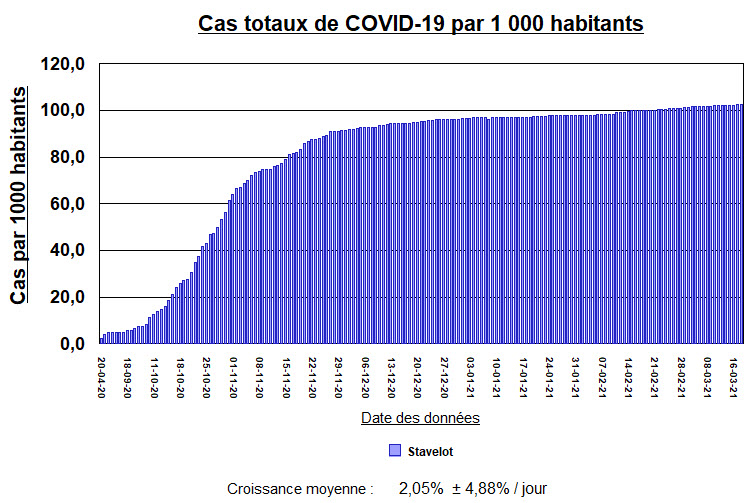
Look at the small town where I live.
Population: 7 205 inhabitants last 27 October.
Current case rate, extrapolated to a city with a population of 100 000? 55 cases.
55 cases of infection distributed in a population of 100 000 inhabitants.
That doesn't seem like much.
But it just keeps gradually sneaking higher each day (except on Tuesdays).
That looks like this:
Some will say that the above graph overstates the problem. They will say that there are now few new cases on most days. That looks like this:
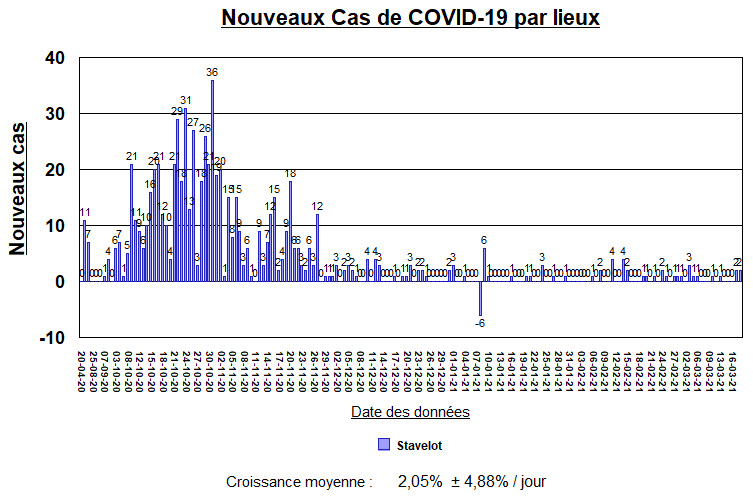
But that small trickle of cases more recently, is just enough to keep the whole thing going.
The response of the city's government has not brought infections down to a zero rate.
Is that a problem only in Stavelot?
Absolutely not.
All of the surrounding towns have exactly the same problem.

The size of the "steps" which show the gradual increase in cases from one city to the next, hasn't changed.
Not a single one has implemented a solution that puts an end to the infestation. I have been following these since last April. 14 local cities in our part of the forest, and not just these 5, but the result is the same for all.
Does a solution exist for any of these cities? : Yes.
Close the borders. Test everyone. Put all positive cases in isolation. It would take 14 days. Perhaps twice that: 28 days. Instead, all of these local towns have been waiting patiently for over a year: While their citizens wait as well, complaining more or less at various times.
No one likes the idea of the only solution possible, in the absence of vaccines.
They heard about the vaccines.
They have waited patiently for them.
But now, too many are still just waiting patiently.
Unfortunately many are already behaving as though the rumor of a vaccine is enough to scare away the virus and get back to "normal life" right now.
They are all marching to the same drum beat. And the drummer is the virus.
It decides the speed of the beat and how loudly it will be heard.
It is a much quieter drum than the sound of the dances at the Laetare.
But it never misses a beat, and it lasts longer than a single weekend.
"So what's a responsible Belgian to do?"
If you are not going to come to a deep understanding of these numbers, the best thing to do is to ignore them completely. They have not so far, and will not in the future, make a difference in getting Belgium healed.
The best thing to do is to get everyone vaccinated.
Then, when that has happened, without even knowing a single number, these case numbers will come down.
It will begin to feel different in the country. It will feel different in the streets,
It will feel different when you talk to your friends.
Anxiety will finally begin to abate.
Nothing succeeds like success.
But to get to that place, all forces must now come together. They must work together.
All efforts must be transparent and the goal is to get 0.3 mL of any vaccine available into each person's deltoid muscle. Twice for the vaccines currently available.
When the vaccine supply runs out, which it will, that can not be taken as a stopping point.
This is not a place nor a time to be patient. To hell with patience!
So far, in the first 75 days of vaccination, getting the job done has not happened.
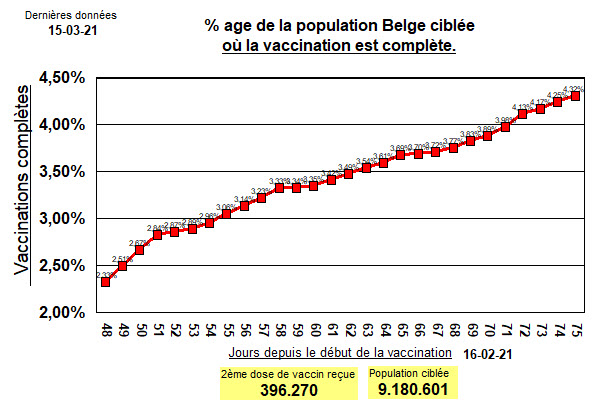
If 4.32% fully vaccinated is thought of as perhaps a nice start, it remains a totally unacceptable figure.
Ignore it. Put all efforts into doing better tomorrow and the day after that.
Pick up whatever tool you have and use it to get you and your neighbor vaccinated.
This is not a time to see if the European Union can pull together and make the right decisions for all of their member countries. As their President has openly declared, this has been another failing.
Too much administration, and trying to pinch pennies and save money looking for the cheapest vaccines to buy has created a vaccine catastrophy.
So get yourself a dose or two of any vaccine.
Yes, ANY vaccine. Waiting any longer will destroy success for everyone, including you.
You want a third wave? OK. Continue to procrastinate about this topic. Take no action.
You'll get your third wave.
If the scientific powers that be in the European Union have any neurons left at all, they will come
to that same conclusion about the Astra-Zeneca vaccine. We are waiting their erudite opinion this day.
Use it all up. Use the Astra-Zeneca vaccine on whoever presents for it. And all should present for it.
Q: "Are you sure?"
Answer: "Yes. I'm very damn sure."
No one wants to be the rare person who gets a clot in his or her cerebral vein and has a stroke.
But no one wants to be that rare person who dies on a ventilator after a month in the ICU in Liège or Antwerp or Bastogne from a coronavirus infection. The whole process of getting sick with coronavirus infections includes a common finding of thrombosis of small and large blood vessels throughout the body.
Q: "Would you rather get a clot from the vaccine (much less common) or from the viral illness itself when you get it? (much more likely)."
Right Answer: "I don't want to get it from either one."
Rare events, though rare, do happen.
Those who have lived, worked and breathed in Medicine learned that the hard way.
It's not what you know that will kill your patient. It's what you don't know.
And for those who worked very hard to learn everything required to save lives, that lesson is learned with difficulty each time. Always accompanied by much pain. Those cases are never forgotten. They are taken by Nurses and Doctors into their retirement and beyond. They are never forgotten.
But even so, most of those who get treated do survive.
"Praise the Lord, and pass the ammunition."
And so we pick up and get on with it.
Most who get coronavirus infection: survive
Most who get the vaccine for the coronavirus: survive.
Overall, complications from either, including death, are rare but always impressive.
And the media will spread it around like suntan lotion at the beach.
Most who will be vaccinated will have nothing to tell about it but the inconvenience of the wait.
Figuring out what effect variants of the virus will have on viral transmission is too complicated and unknown a scientific problem to give an answer right now.
Don't strain your neurons trying to figure it out.
Go get 0.3mL in either deltoid muscle.
To get picky and choosey about which vaccine you will accept, is an insult to those who worked day and night, and all the weekends, to bring you this great gift and prove its safety. Accept it thankfully.
When the system of appointments for vaccinations breaks down: Yell and scream about it!
When no one wants to show up on a Monday to be vaccinated: Yell and scream about it!
When large vaccination centers are empty, that is a disgrace: Yell and scream about it!
When there are more women being vaccinated than men, come together: Yell and scream about it!
When one region of Belgium gets more people vaccinated than another: Yell and scream about it!
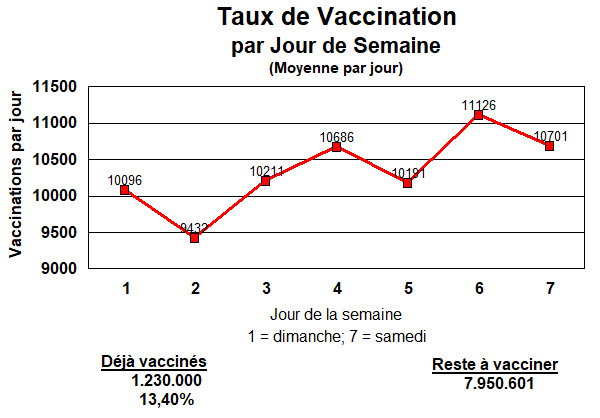
When the current rate of vaccination predicts that vaccinations will be complete May 20 of 2023: Yell and scream about it!
When the newspaper or television callously scares everyone to death with another report of someone with a clot that formed somewhere, or some other complication, doing that is wrong. It's practicing Medicine without a license: Yell and scream about it!

Here are today's figures:
This is not a time to listen to voices giving detailed explanations about how Belgium got into this mess.
This is not a time to listen to voices predicting a third wave of cases and arguing about the details of why, when, and how many cases there will be, and whether France or Belgium is out in the lead of cases and deaths. Tell those people: "I don't care. Give me a shot of vaccine, and be quiet."
It is time to put people with flasks of vaccine, and the equipment required to give it, on every street corner of Belgium until everyone has had the doses required.
Do what you must, but get 0.3 mL (0.5 mL for some) of any available coronaviirus vaccine in your muscle.
Then, while keeping your mask on, walk away with a smile.
Tout dépend de la façon dont les chiffres sont présentés.
Notre avis nous est-il demandé ou donné?
Les chiffres et données doivent-elles être présentées de manière à informer objectivement, clairement, honnêtement?
Ou devrait-elles être présentées pour convaincre les autres de son point de vue personnel et de ses opinions sur une situation donnée? Pour soutenir un argument prédéfinit?
Regardons les données d'aujourd'hui de Sciensano. Plus précisément, leur calcul des tendances des décès dus à ce virus en Belgique.
Regardez ci-dessous. Quelle est votre conclusion sur les décès?
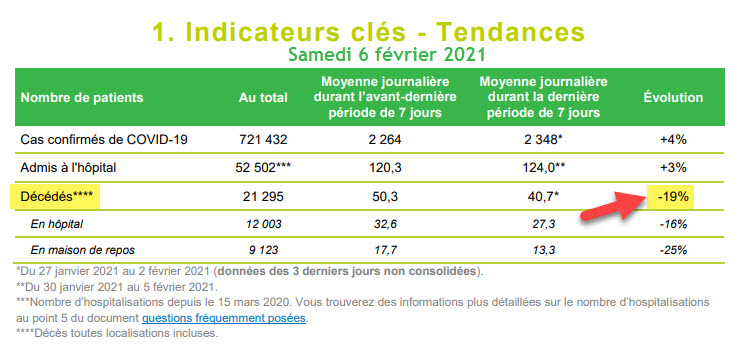
Les décès diminuent, bien sûr. Une réduction de 19%. C'est parfaitement clair.
Allors voyez ce que vous pensez de cette idée suivante.
--------
Prenons tous les décès en Belgique dus au virus, depuis le premier signalé le 10 mars 2020.
Cela fait 21 295 morts. J'accepte leur chiffre de ce jour.
Prenons maintenant tous les jours du 10 mars 2020 au 5 février 2020.
Et divisons cet intervalle en deux. Certains peuvent souhaiter appeler ces moitiés les première et deuxième vagues.
Voici la première moitié :
Avec son pique augmenté par, on nous avait expliqué dans les médias, quelques euthanasies de personnes des maisons de repos, pour éviter de falloir les soigner dans les hôpitaux. Mais la plupart, supposons, des décès dus à la maladie de COVID-19.
C'est bien que cette période difficile est derrière nous, et que les décès, et donc le stress sur les hôpitaux diminuent. -19% en moins signalé ce jour.

Notez bien: 9852 décès sur 166 jours.
Voici la deuxième moitié.
(Permettez-moi d'ajouter entre parenthèses que tous ces chiffres présentés ici proviennent du fichier Excel d'aujourd'hui, rendu public chaque jour par Sciensano.)
Je remarque également que récemment, le nombre de décès par jour a du mal à revenir à un niveau de référence nul. Comme si tout ce qui contribue à ces décès n'est pas encore terminé.
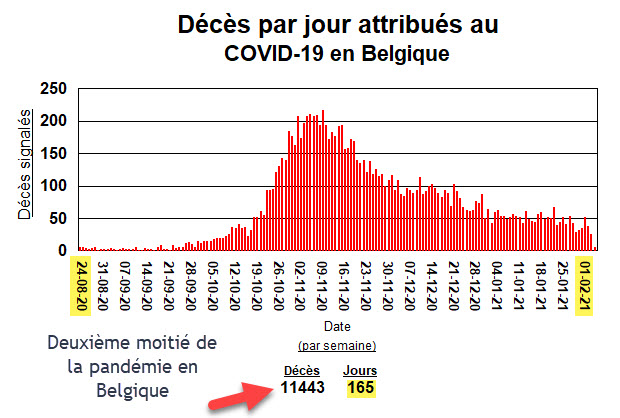
Donc, sur la moitié qui fait un jour en moins que la première (165), 11.443 décès.
Quoi!? C'est plus!
Oui, exactement 1.591 décès en plus.
Si on fait le calcul, les décès ont augmentés de 16,2% de la première à la seconde moitié!
Pardonez moi pour pousser le bouchon un peu, mais c'est plus. Pas moins de décès, mais plus! Les décès augmentent!
---------
Alors, laquelle de ces présentations des données relatives aux décès est correcte?
Bien sûr, elles le sont toutes les deux.
---------
La différence qu'est maintenant assez évidente (plus de décès dans cette deuxième moitié et non moins de décès) est simplement cachée dans la façon dont on décide de présenter les chiffres.
Certaines personnes trouveront «cachée», un mauvais choix de mots.
L'autre choix? Laisser les données parler d'elles-mêmes. Mais présenté aussi inclusivement que possible. Pas hypersélectionné.
Souhaitez-vous plutôt d'examiner les données pendant 165 jours, ou 14 jours avant de prendre une décision ou former votre opinion?
Mais si on vous donne votre opinion, peut-être que ces petites différences n'ont finalement aucune importance. Les décès diminuent, et c'est comme ça.
De leurs côtes ...
Doit-ils d'abord décider du message à transmettre au public, puis structurer la présentation des chiffres pour prouver l'argument? C'est un peu ce que l'on vient de voir ci-dessus me semble-t il.
Cela peut être une bonne approche, tant que ceux qui dirigent ne sont pas aveugles ou gravement incapables de prédire l'avenir. Si c'est le cas, leur choix de la façon dont ils présenteront les données (c'est un choix comme nous venons de le voir), peut nous conduire tous dans un trou assez profond.
Mais cette petite comparaison n'a aucune importance puisque nous serons tous très bientôt sauvés par le vaccin.

Enfin, pas si "tôt" que ça peut-on remarquer.
Les choses deviennent glissantes pour les vaccinations
Sur le même sujet que hier, si pas encore lu. C'est une petite étude qui passe du taux de vaccination à la date prévue pour les avoir terminées, ces petites piqûers.
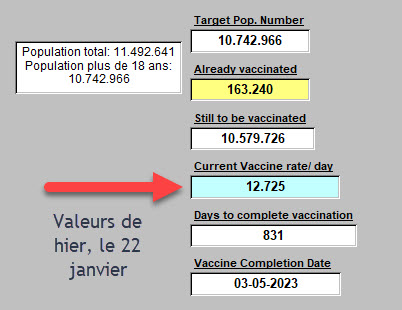
Hier, les chiffres annoncés apportaient le résultat suivant:
Pour mieux comprendre:
-
-
- Il restait 10.579.726 personnes de 18 ans et plus à vacciner en Belgique avec le vaccin Pfizer-BioNTech. (Et d'autres vaccins aussi).
- Le taux de vaccination par jour était en moyenne 12.725 personnes vaccinées.
- Ceci suggère encore 831 jours pour achever ces vaccinations (sans parler de la deuxième dose).
- Cela se traduit sur le calendrier au 3 mai 2023 pour avoir terminé de piquer tous ces adultes en Belgique.
-
-----------
Comme si ce n'était pas déjà assez mauvais comme résultats ...
Et comme cela peut arriver dans la vie, quelqu'un arrive et complique les choses.
Les administrateurs sont parfois comme ça. Cette fois-ci, un "taskforce" remplis d'administrateurs.
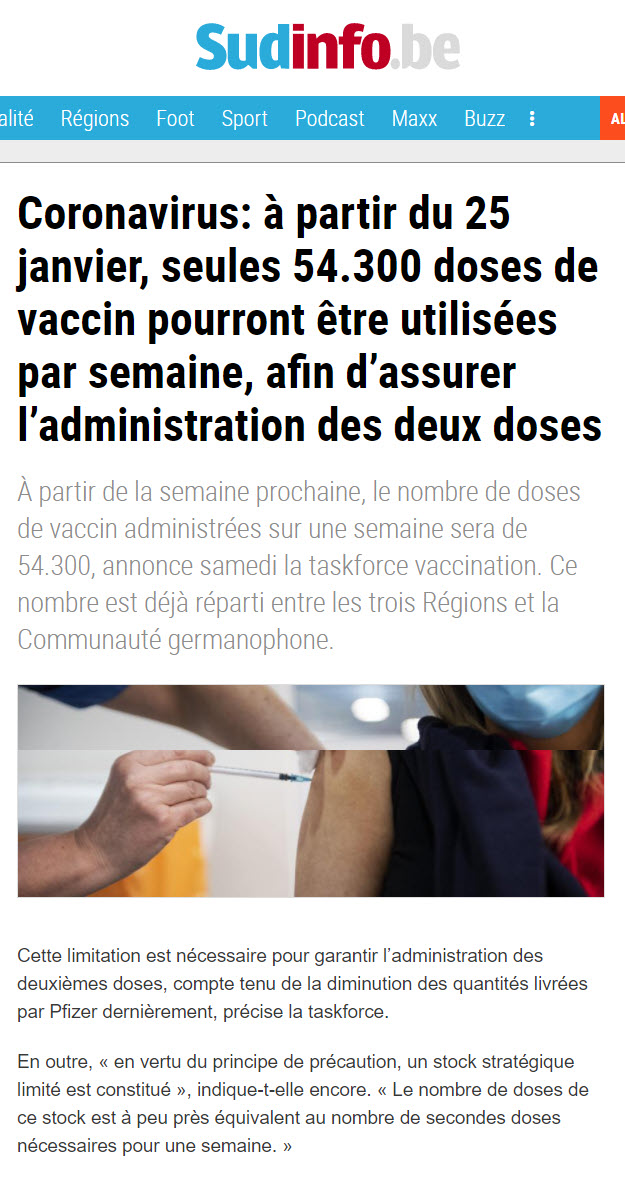
Voici, ci-dessous dans les NEWS, comment cela a été vite glissé vers la population sans aucune mention faite lors de la dernière convocation des grosses têtes du gouvernement vendredi.
Oho.
Et 54.300 doses par semaine, cela donne quoi?
Cela donne une allure de vaccination de 7.757 personnes vaccinées par jour.
Au lieu de la moyenne signalée hier de 12.725 personnes par jour.
Voici à peu près le résultat prévu dès lundi, le 25 janvier ...
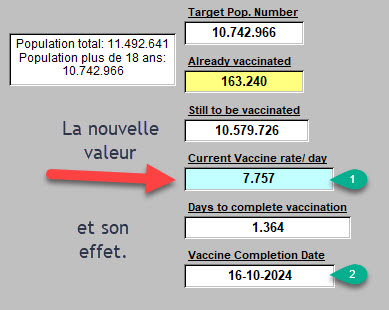
Donc, à cette nouvelle allure, on terminera dans 1.364 jours, cette phase de vaccination en Belgique le 16 octobre 2024.
Mais le "taskforce" est sur le problème comme un chien renifleur, alors ne craignez rien.
Conclusion?
La même que hier.
Il faut encore (et toujours) un Plan "B".
<<<<< l'Acceuil