
Monde/ World
Power to the people !
CoronaSTAVELOT.com
Thanks for visiting!
To translate this page, select your
language from the dropdown menu below:
We sink or we swim, together. On coule ou on nage, ensemble.
CoronaSTAVELOT.com
Thanks for visiting!
To translate this page, select your
language from the dropdown menu below:
Utilisez le traducteur ci-dessus pour lire ceci dans votre langue.
Gebruik de vertaler hierboven om dit in uw taal te lezen.
Verwenden Sie den obigen Übersetzer, um dies in Ihrer Sprache zu lesen.
使用上面的翻译器以您的语言阅读此内容。
Donations of vaccines against SARS-CoV-2 are falling behind.
While Belgium and other countries are pushing 3rd "booster" doses, and considering
mandatory vaccination laws as will be implemented in Austria, the pandemic continues to rage.
If we don't implement and support methods to get those in poorer countries vaccinated,
with a little time, that behavior will become its own punishment. In the countries where more than
80% have been vaccinated, it souldn't just end there.
Do what you can. Do what you must.
But help to bring vaccines to the poor.
And it's not just the vaccines. It's the infrastructure that must be put in place to vaccinate
those who present to be vaccinated. Several sountries have already thrown away vaccines
because they don't have in place this infrastructure, and the vaccines reached expiration dates.
Support COVAX. Support Gavi, the Vaccine Alliance.
Here is why Gavi has failed so far.
Don't let it be a beautiful idea and nothing more. That must stop.
For your health and mine, as well as theirs.
We sink or swim together.
Numbers Great and Small
CoronaSTAVELOT.com
Thanks for visiting!
To translate this page, select your
language from the dropdown menu below:
Servez-vous du traducteur pour mieux comprendre si besoin.
Des traductions parfois un peu ratée sorte aussi bien que des bonnes, mais le sens générale y est.
WORLD
Having followed the numbers since last February 27, 2020, essentially soon after the pandemic began here where we are, an overview at this time finds numbers large and small. These instruct several things but let's focus on just a few.
Here is our page that we complete each day. It has been annotated with some numbers to serve as a guide. Notice first, the values in pink fields. These are from last February 27th, our Start Date (SD). In yellow are today's values, January 24, 2021, referred to as the Data Date (DD) in the labels. And in light blue, are fields that calculate changes between the two dates.
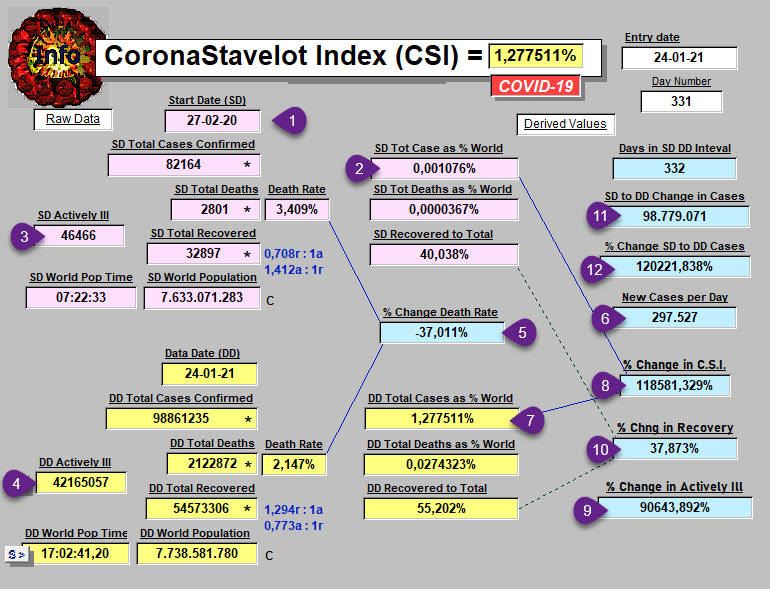
By the numbers :
-
-
- The start date (SD) Feb. 27th
- The Total Cases of COVID-19 reported that day, as a percent of that day's world population: 0.0011%. That seems like a very small number.
- The number of Actively iLL on that start date: 46 466.
- The number of Actively iLL in our world today: 42 165 057. That's an increase of 42 million 118 thousand 591 persons. That's a 90 644% change. A number too large to mean much in my mind as I stare at it.
- Deaths in this same interval have decreased from 3.41% of COVID-19 cases to 2.15% That's a more comprehensible -37% decrease. Without showing the data here, that transition has been gradual and constant, appearing to bottom out at the present time since a week or so. Many attribute this to better care of those infected. That explanation should show stepwise progress, but doesn't. There may be another explanation. The virus may have "learned" (meaning modified its genetic RNA material) to accomplish the following. Increased lethailty or mortality means that it loses more human hosts. Its goal is to make virus babies. It needs humans to do that. "Dead men tell no tales." And dead hosts can no longer contribute to continued transmission. It has therefore made modifications to be less lethal, but more transmissible, as current news is confirming with "variants."
- New cases per day in the world: 297 527.
- Total cases this day as a percent of the World's population: 1.278%. That seems like a small number. Thank goodness that it is. With all of the economic effects and cost of lives and health and education and convenience that are so evident, how can only 1.3% of the world's population be involved? What if the numbers reported to, and and collated by Johns Hopkins each day are off by a factor of 10? Then, 13% of the world is affected. This teaches us as much about our world's population, as about how much or little the pandemic has impacted it. In spite of illness and death, world population has increased from 7 billion 633 million 071 thousand 283 on February 27, to 7 billion 738 million 581 thousand 780 today. A net increase of 105 million 510 thousand 497, or +317 thousand 803 net per day. After the pandemic, population is the next challenge on the list of things to do.
- The increase in the percent of the population involved represents a change from Feb. 27 to today of 118 581%. A number too large for me to fathom.
- Here is another one from the light blue fields in the database. The change in those Actively iLL with the virus since end of February to today represents an increase of 90 644%.
- Thankfully, people are recovering. In February, 40% of declared cases had recovered. Today, 55.2% of total cases have recovered. That's a 37.9% increase in recovery. Or if you prefer: on Feb 27, 32 897 had recovered; today 54 million 573 thousand 306 have recovered. That's 54 540 409 more. There is hope.
- Total cases between the two dates increased 98 million 779 thousand 071.
- That's another number too large to comprehend. A 120 222% increase. Amazing.
-
Here is another way of gauging improvement.
For each person still ill at this time, how many have recovered?
Last October 5th, that ratio of Recovered to Actively iLL was maximal at 2.543 : 1.
More than 2 individuals in the world had recovered, for each one stll sick.
Winter so far has taken its toll to have a clear effect on this relationship, and as shown below:

The last few days have seen an encouraging upturn in the green line with stars. But the ratio, 1.294 : 1 yesterday and today is strikingly reduced from October values. More people are getting and staying sick.
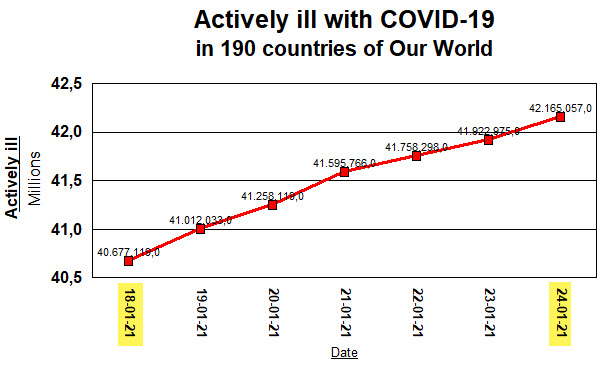
A simpler graph follows below. It shows the number who are still ill with COVID-19 in the world in the past 7 days.
A longer period of observation leads to the same conclusion. An increase of about 2 million per week in those counted as being sick with the virus. This curve has not rounded much to flatten at the top as when growth rate slows.
VACCINATION : the eagerly awaited, and rapidly prepared miracle
Panacea was the Greek goddess of healing. And the word means "the remedy for all." Will the vaccine be that?
Too early to tell, but the race between the numbers presented above, and those that follow, is definitely on. And while earliest reports about "variants" tried to be most reassuring about vaccine effectiveness, this assurance weakens a bit as time goes on.
Manufacturers (Moderna for example) are already shipping "booster doses" with modifications made in the vaccine to respond to the viral variants.
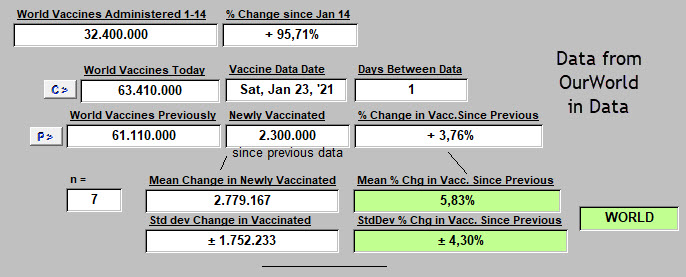
Again, huge numbers. A mean of 2 million 779 thousand 167 vaccinated per day. And an average increase in that figure per day of 5.8% since it began. A 96% increase since 14 January, for these January 23rd data.
Is that rate high enough? How long will vaccination actually take?
The non-vaccinated are obviously a sub-population at greater risk. Not only for acquiring the illness, but for transmitting the virus to others still not vaccinated.
The term "mandatory vaccination" has already appeared.
We'll get closer to an answer as we look next at Belgium. A country near and dear.
BELGIUM
Like so many countries, Belgium has had its share of lockdowns and non-pharmaceutical interventions (NPI's: masks, hand hygiene, distancing, quarantining, contact number limitations, aerating spaces, travel restrictions, etc). Belgium had a period during a first wave when deaths seemed too great in number when compared with some other countries. That's a separate subject.
But what has been the effect of all the expert-guided government interventions?
Here below is one way of summarizing it. And of course in what follows, we do not have a set of control results, where no or fewer interventions had taken place, to compare with.
From one day to the next since Belgium's first case of COVID-19 was declared February 4 of last year, what has the overall growth rate in cases been?
It varies significantly by day of the week.
As odd as that may sound, it is real and presented below.
It certainly reflects how the health, testing and public health system works, more than any effect generated by the virus.
The virus doesn't use a weekly planner as far as I know.
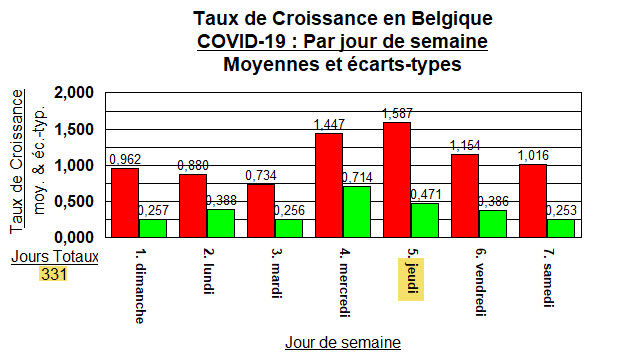
Three hundred thirty-one days grouped above by day of week into mean values with standard deviations.
These are growth rates in cases, from one day to the next. Least on Tuesdays, and highest on Thursdays. Always like that. Count on it. The government announces most good news decisions on Tuesdays, using "good" numbers. Tighter restrictions are invariably announced on Fridays. Defended by the "marked new increases" on that day, but especially the Thursday just before.
The goal is of course a growth rate of less than 1.0.
So Sundays, Mondays, Tuesdays look pretty good.
It's also important to recall that this calculation of growth rate change depends on reported new cases, day after day. And "cases" are probably 8 to 12 times fewer in number than "infections" (i.e., viral transmission events) in the community. So a different world of viral infections is actually what is being lived. Not the numbers and graphs presented each day and every few hours on TV News.
That weekday variation may generate some interest, but of more importance is to answer: "Where has this growth rate been, where is it now, and where is it going?"
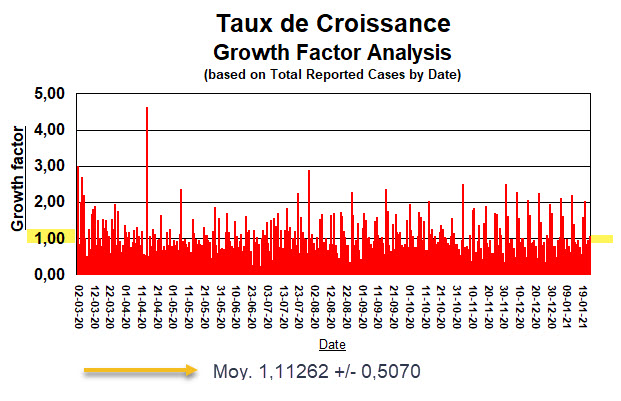
One should notice on the above graphic :
-
-
-
-
- The goal is again: to obtain a value less than 1.0, and stay there.
- The daily red bars are at times above and sometimes below 1.0
- Overall, a rather monotonous progression from left (March 2, 2020) to right (January 24, 2021).
- 12 very high days above 2.0, and some down around 0.5 or non-growth.
- But most importantly, a mean value of 1.113, and that is above 1.0. And not much variation around that average value (± 0.51). That means that on average, the number of infections and cases has been growing right along. Right through announcements and intervantions and restrictions and lists of specific do's and don'ts. Right from the start. Just enough to keep viral transmission a reality in the population.
-
-
-
Of course those in public health and decision makers in the government would quickly argue that if they had not stepped in with varying levels of restrictions, it could and would have been much worse. Probably true. We don't know. We don't have that control group to compare with, other than "in principle" as found in epidemiology and infectious disease texts.
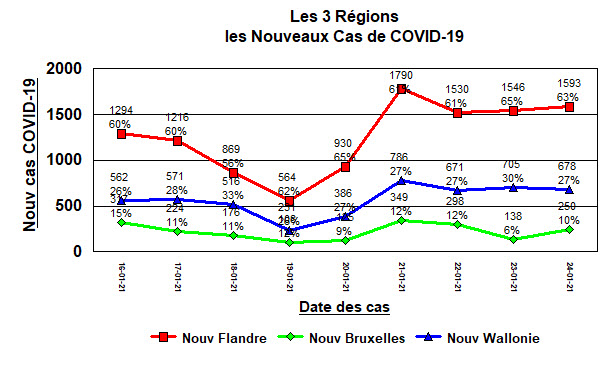
One can gaze day after day, as we have done, at case numbers. Since the country is divided into 3 or 4 parts, that looks like this graphic below.
New cases in these three regions of the country in the past 9 days:
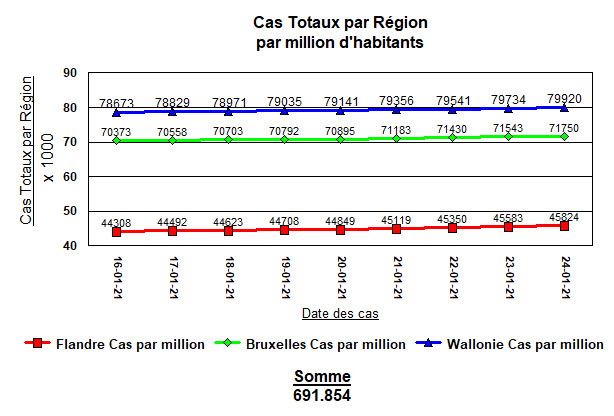
And correcting for population effects gives this next graph below:
Almost twice as many people live in Flanders as Wallonia. Here is the distribution of the 691 854 total cases reported today. Here the last 9 days with cases per million inhabitants in each region.
Expressed this way, Wallonia has the most total cases, and all regions are increasing gradually but consistently. Inconsistent with this result, the primary or central sites for vaccination "en masse" of the population are located in Flanders, and not in Wallonia. "Mobile units" have been proposed to take up the slack in the eastern regions.
Perspective:
691.854 total cases divided by a population of 11 492 641 = 6.02% of Belgium's population impacted. World value (as noted), 1.28%, and even less since that figure includes Belgium's case totals.
DEATHS IN BELGIUM
These have taken on the following look:
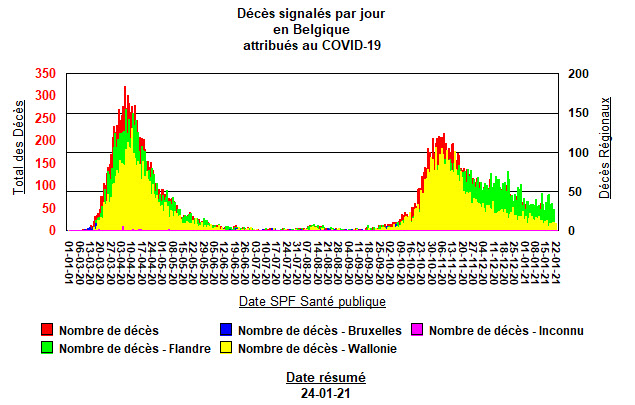
Below are "first wave" and "second wave" COVID-19 mortality events in Belgium.
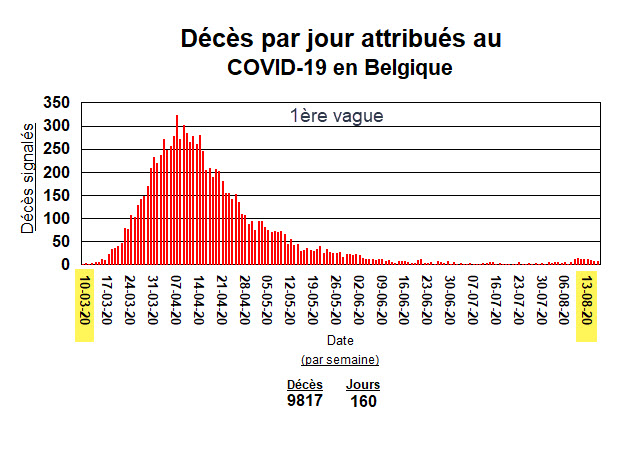

Pretty equally divided in terms of duration (160 days), with already 1 145 more deaths to report in this second half.
Without getting into regional details, several observations can be made here:
-
-
-
-
- During the "first wave" the peak in deaths was higher than in the second. This was also associated with a certain number of deaths, as already publicly presented by the media, due to euthanasia of certain patients rather than admitting them to a hospital. We'll stay with that polite term of euthanasia to describe what happened, quoting the media.
- Although presenting a lower peak, the "second wave" of deaths seems to be having a harder time at dropping back to the baseline. In fact when similar periods of time are added up, the "first wave" accounts for 9 817 deaths, and the second for 10 962 to date. For us, that's an 11.7% increase in deaths.
- This fact is being minimized by public health using 14 day averages and other devices to conclude today that deaths in the past 14 days had increased +1%.
- The public is also becoming more desensitized to these death events.
- Not a point to belabour.
-
-
-
--------
All this says that the virus is winning in Belgium, as in many other countries at this time.
And although "anti-vaxxers" are readily found, little by little the majority vote is: "give us the vaccine. Quick." Of those in healthcare, 90% want to be vaccinated. In the population, 70%.
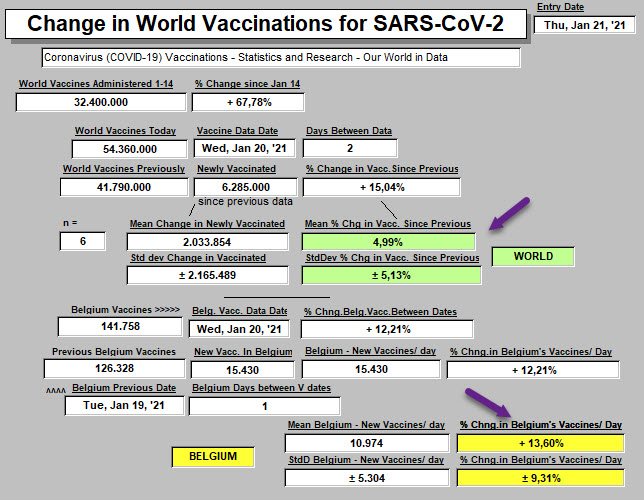
VACCINATION IN BELGIUM : How is that going?
Our World in Data shows it like this ...

Or again corrected for population effects, and staying in the EU ...
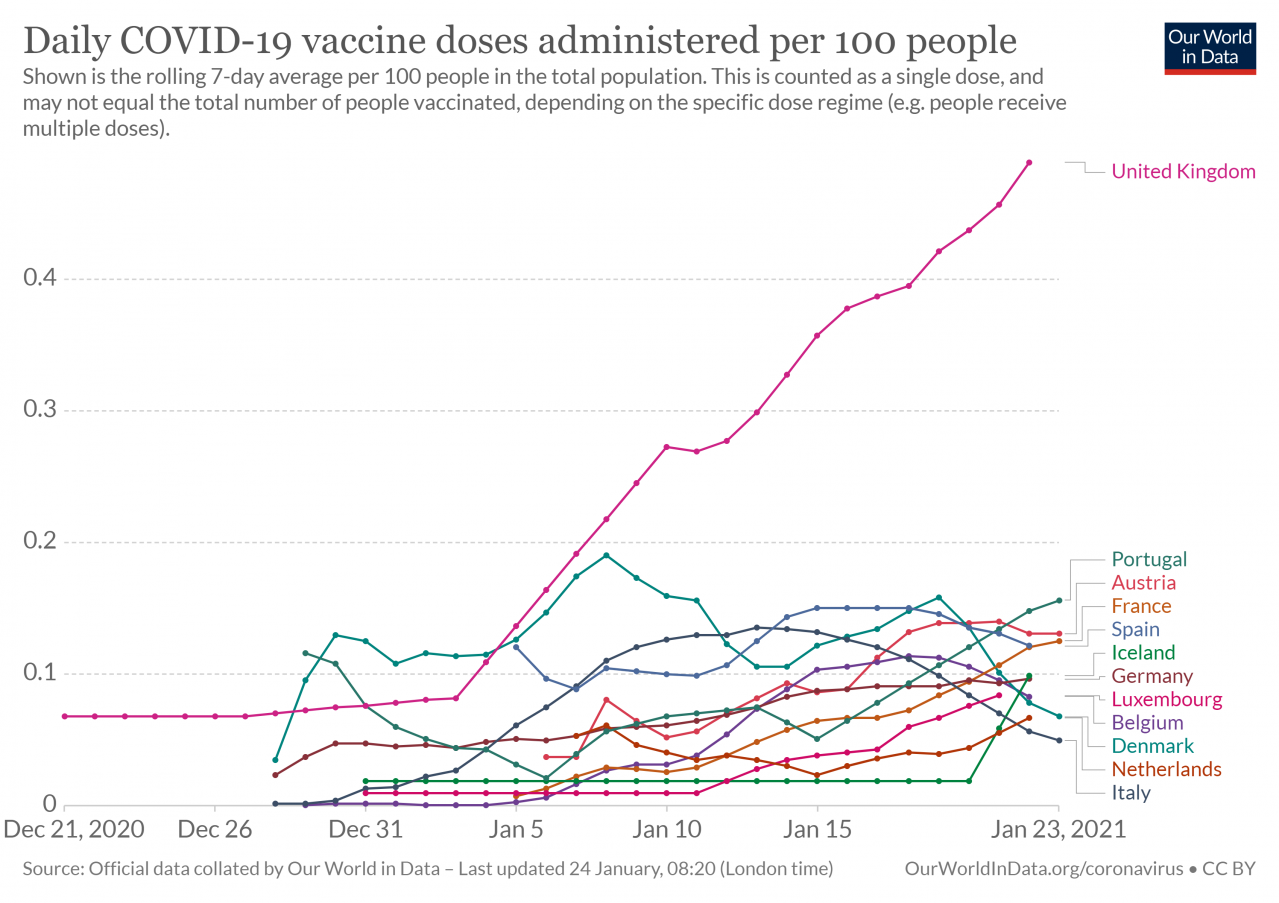
Local NEWS uses the above data to quickly point out which countries Belgium is ahead of. Their reports seem at a bit of a distance from certain events like "six doses in a flask" and how that will impact on delivery of product. Not only in the USA, but especially abroad where a few promises have already been broken.
To unscramble all of those lines, below are offered a few numbers that are easier to grasp.
Tomorrow, they will be off by quite a bit since a mandatory limit on vaccinations of 7757 vaccinations per day will go into effect. This, to save product for the "second vaccine" group that is arriving at day 21 after their first vaccination.
That reduction slid by in the NEWS, mostly unperceived and uncommented.

So at previous vaccination rates shown above of:
-
-
-
-
-
-
-
- 12 553 vaccines administered per day
- It will take 842 days to get everyone 18 years and older their first dose of a to dose vaccination process.
- That date is 15 May, 2023.
- (Not shown) The effect of the 7757/day limit changes that completion of the first round date to 16 October, 2024. (Some people are going to be upset by that).
- This led us to a conclusion in a previous article that what is desperately needed is a Plan "B" aimed at bypassing problems with vaccine disbursement.
-
-
-
-
-
-
AN UPDATE of these figures on January 26:
For the Jan 24 to Jan 25 period, 3 412 new vaccinations. That value brings the mean down to
10 086 ± 4 902 vaccinations per day.
Time to completion of 1st round? 1 044 days. That date? 5 December 2023.
It's going in the wrong direction.
Is there a regional effect seen for planning vaccine distribution? Absolutely.
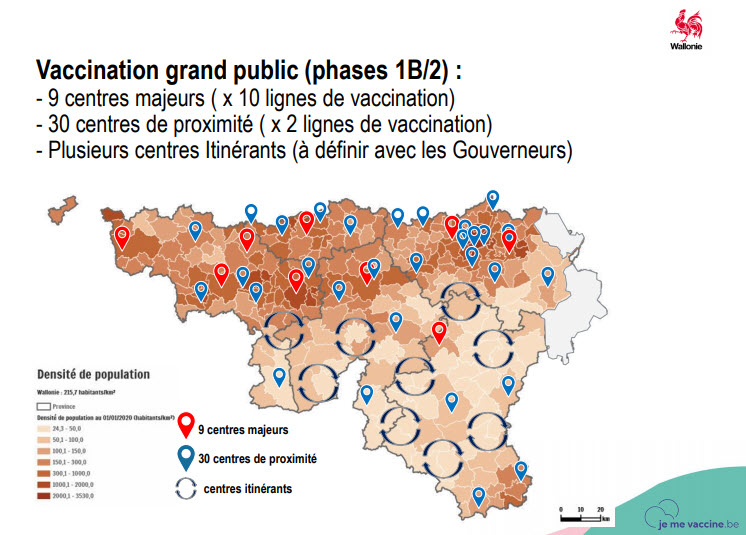
Major centers that can present 10 lines for vaccination, "centres majeurs" (major centers) are only on the map in Brussels and western Belgium in what are presented as higher population density areas. None in Wallonia. There, lots of mobile vaccination units are promised.
AT A LOCAL LEVEL
People get sick with this usually one at a time. They usually get sick once, "caught" wherever each person is or has recently been in proximity to an infected individual. That "transmitter" may be sick or not, but infected. Those are the basics. Unless one intervenes in an infectious disease, it follows its natural history.
Here's what is happening locally.
We've been following 14 towns including our own in the Walloon region of Belgium.
Selected more for their proximity than any other reason. Some are more touristy, others less. Some have hospitals, most don't.
Here for instance are 5 nearby towns, cases per thousand population:

One identifies a constant, strikingly monotonous increase, with all 5 marching along like a unit.
This also means that no particular local city government has done something which destinguishes it to reduce new cases. At times some have condonned folkloric festivities over a weekend. Invariably such decisions were a proven error. Not shown is that one such city of these 14, has yet to recover from this bump in cases last August.
When did this climb begin?
Last April 20th or so. But picked up speed in August and after. Again, quite uniform throughout the region. Here is how that looked in one city of 7 250 inhabitants:
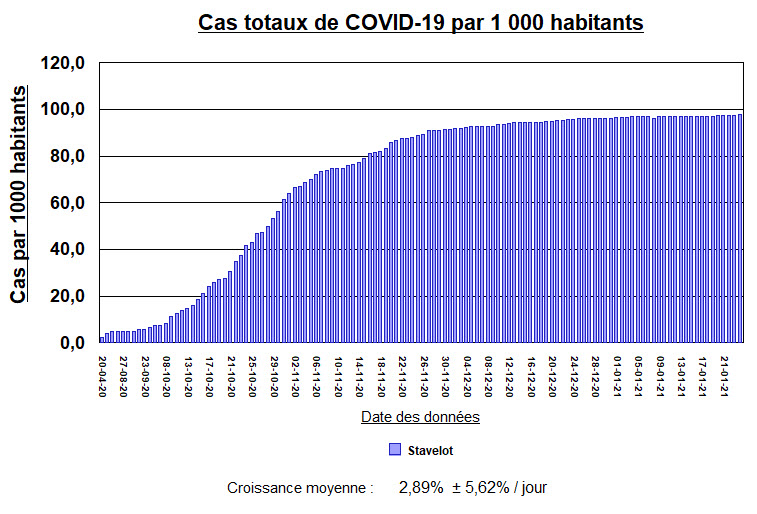
The steep rise began in October, and at present, the daily additions just keep creeping up.
These are of course case totals which can be misleading if not understood as such.
New cases for the same city look like this:
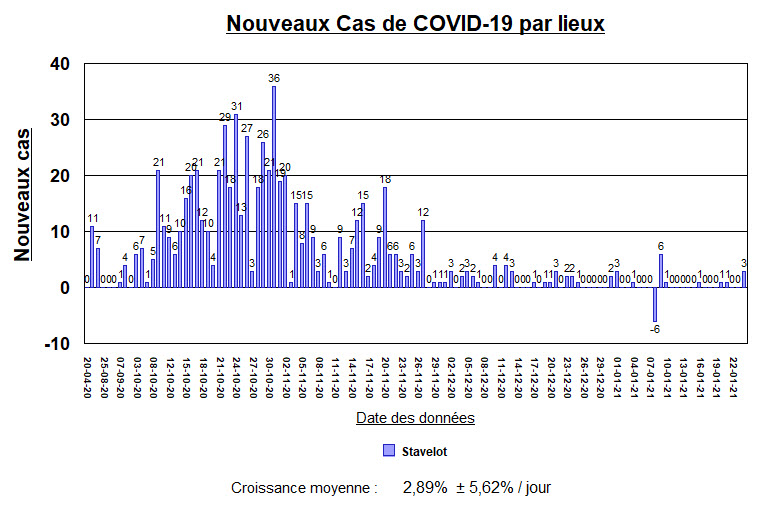
How can one have a -6 value for new cases on January 8? When Public Health plays with the numbers. That's how. On that date, most of these 14 cities had negative values. Tinkering. Fixing previous errors.
What is the "gestalt" or attitude in town?
-
-
-
-
- The numbers are better, so the need for restrictions are less well understood, tolerated, followed.
- There seems to be much less interest in current results, with a clear shift towards getting vaccinated and equating that to rapidly bringing an end to the pandemic in Stavelot.
- In meetings of the City Council (ZOOMed and carried on Youtube for the public) the term COVID is heard fairly often to explain what has or has not yet been accomplished in their planned programs. Mention was made of the possibility of reassigning a gymnasium-sized indoor facility to vaccination tasks if needed.
- No discussions were heard that, at this time when new case numbers are down, a Plan "B" should be defined, with more testing, positive cases identified and managed, and consideration given to controlling more tightly, access to the city's borders.
- An attitude clearly emerges that such decisions entail simply following individually, what the federal government decrees through its preferred experts. A local departure from published federal public health instructions and limitations seems, if not anathema, highly unlikely.
-
-
-

SUMMARY
-
-
-
- As one moves from the pandemic situation in the world, through Belgium as a country, to local pandemic manifestations over time, it prompts several thoughts. One is "think globally and act locally."
- Globally, we're surrounded with more cases.
- But in fact, much thought directed towards the world from here locally, is too often directed at how to circumvent logical restrictions on travel for example, and to doing what one feels like doing. And this seems independent of potential social impact on others.
- An understandable reliance on emerging vaccination procedures as a prompt salvation, while unambiguous, may be somewhat naïve. This past year in Belgium has too often demonstrated instances of confusion, misinformation, and decisions that added major delay to doing the right thing as soon as possble. In their defense, doing the "right thing" was not always clearly defined at the time decisions were taken. Often, no decision was taken. This history makes a smooth and effective vaccination process much less likely.
- Cases began in Belgium with a movement of the virus from out of country into its interior. That has not changed as recent arrivals of out of country "variants" makes quite clear.
- While lacking a control group for comparison, all of the official responses to the pandemic in Belgium since its beginning February 4, 2020 and accomplished via varying levels of Non-Pharmaceutical Interventions (NPI), remain associated with a mean growth rate for viral infections and cases, greater than 1.0. The virus is winning. Has been from the start.
- Given continuing trends of case increases at a global, national and provincial level, local towns should embark on defining and implementing local control of the pandemic. Models for how to do this are now plentiful. Methods from the plague years of the middle ages should not be scoffed at before being carefully studied. Instead, they are simply marching in step, and the drummer is the federal government. Not much of an identifiable spirit of rebellion. The Palais de Justice in Brussels is safe.
- Evolving and networking support for such local Plan "B" action at the present time, is either not ongoing, or very difficult to clearly identify in presentations by city governing bodies.
- Time is of the essence. When the intruder is banging at the gates, pulling up the drawbridge is not a bad first response.
- Wider testing "en masse" is now quite possible for an entire community of 7000 inhabitants. The easier salivary tests have proven themselves equally sensitive to the less pleasant nasopharyngeal swab. Using canine "sniffers" to test those moving about in public is no longer just a demonstration attraction. Construction or conversion of existing facilities for isolation of posiitive cases has been proven effective. If barriers can be put in place to control tourist admissions to the city during folkloric feast days, how to accomplish the same for viral case control should be promptly addressed.
- If these last-mentioned maneuvers seem harsh, they need not be and they need not be permanent. Stavelot specializes in setting up spaces in which people congregate to have fun. Effective implementation would decrease caseload within weeks to near zero permanently. Some will say that locally the caseload is already near zero. But without guarantees. Belgium has been living an essentially unchanged growth rate that has been smudging along since the pandemic passed its borders to install itself. With current daily new cases still low, this is the time to react, not to put another log on the fire and wait for a Spring assured by vaccination.
- Time is of the essence. And it becomes increasingly clear. We're all in this together. Believing that events going on at a distance from us in our world, have no impact on us, is clearly a myth.
-
-
<<<< Home
Les vaccins
N'oublions pas le Monde entier (World) !
Source: Our World In Data.
(Pour plus de données sur ce sujet).
Mise à jour du 21 janvier
<<<< Home
Le 6 janvier 2021
Que deux images ...
Ceci à Los Angeles en Californie, aux États-Unis.
Première image.
Des gens font la file à travers les parkings d'un stade de baseball.
Ils sont tous là pour se faire tester pour le SARS-CoV-2 virus.
Les résultats sont promis au moment où la personne testée est rentrée chez elle.
Envoyé par SMS, e-mail ou appel téléphonique.
Tous ceux qui veulent un test peuvent passer un test.
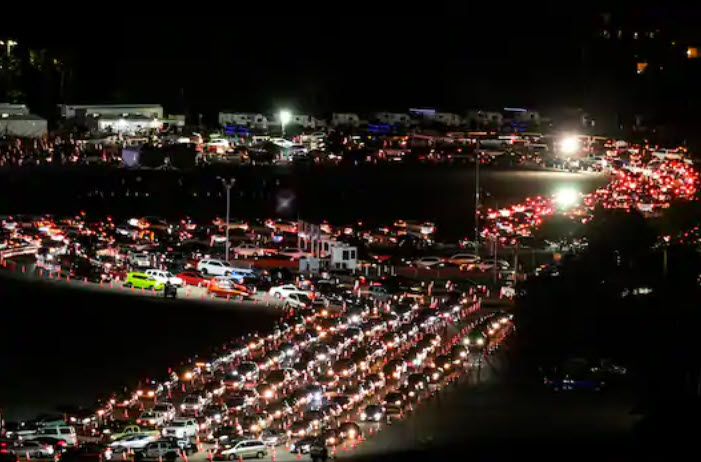
(c/o the Washington Post)
Deuxième image, ou plutôt une vidéo.
Dans les hôpitaux en Californie ce jour.
Là c'est plus dure que de simplement faire la file et attendre. Mais des malades attendent dans des tentes à l'extérieur de l'entrée à l'hôpital.
Le comté de Los Angeles a été tellement débordé qu'il manque d'oxygène, les équipes d'ambulance ayant reçu pour instruction de n'utiliser de l'oxygène que pour leurs patients les plus défavorisés. On a dit aux équipes de ne pas amener les patients à l'hôpital s'ils ont peu d'espoir de survie et de traiter et déclarer ces patients morts sur les lieux pour préserver la capacité de l'hôpital. Plusieurs hôpitaux de Los Angeles ont refusé le trafic ambulancier ces derniers jours car ils ne peuvent pas fournir le flux d'air nécessaire pour traiter les patients.
Cliquez sur les petites flèches à droite pour agrandir la vidéo.
La plupart des patients de cet hôpital son Latino et vivent dans le "haut désert" à l'est de Los Angeles. Donc, les affiches et renseignements sont souvent en Espagnol.
Je traduis celle ci-dessous ...
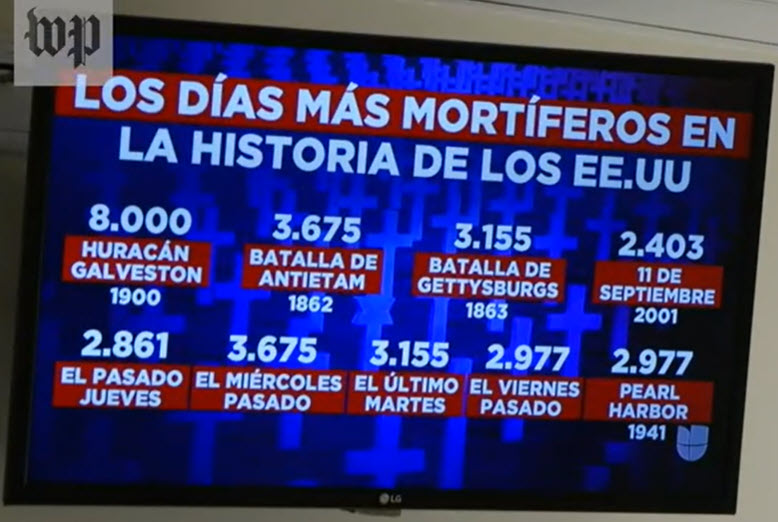
C'est une comparaison du nombre de décès historiques aux États-Unis, avec ceux à présent en Californie (1 des 50 états des États-Unis):
l'Ouragan à Galveston (Texas, en 1900) - 8.000 morts
La Bataille d'Antietam (Maryland - Guerre Civile, 17 Septembre 1862) - 3.675 morts
La Bataille de Gettysburg (Pennsylvanie - Guerre Civile, 1 au 3 juillet 1863) - 3.155 morts (1.600 dans les premières 6 minutes de battaile).
Pearl Harbor (Honolulu, Oahu, Hawaii, 6 décembre 1941) - 2.977 morts
Le 11 septembre (911 - Ney York, NY, 11 septembre 2001) - 2.403 morts
Vendredi dernier, ici en Californie - 2.977 morts
Jeudi dernier, ici en Californie - 2.861 morts
Mercredi dernier, ici en Californie - 3.675 morts
Mardi dernier, ici en Californie - 3.155 morts
A ce jour en Californie,
Cas Totaux: 2.536.686
Activement malade: 2.508.607
28.079 morts dans l'État. Dans la ville de Los Angeles: 11.349 morts.
Récupérés: 0.
Dans de nombreux endroits, la bataille se poursuit 24 heures sur 24.
«Je pense que si vous ne preniez pas cela au sérieux avant, il est maintenant temps de prendre cela au sérieux." (Mendy Hickey, infirmière à l'hôpital de St. Mary Medical Center, Los Angeles, Californie. Actuellement, elle travaille 15 heures par jour, tous les jours).
Et essayons de ne pas oublier d'où proviennent les vaccins venant vers la Belgique et qui arrivent chaque jour: Pfizer (New York, NY - prépare actuellement des vaccins près d'Anvers); Moderna (Cambridge, Massachusetts); NovaVax, Inc. (Gaithersburg, Maryland - préparation du vaccin pour l'Europe à Rockville, Maryland et Uppsala en Suède).
Ce que les dirigeants de ces entreprises ont dit: "Bien que tous les États des États-Unis aient désespérément besoin du vaccin à ce moment, nous n'oublierons pas ceux qui en ont besoin en Europe. Nous ne les avons jamais oubliés dans le passé, et nous ne le ferons pas aujourd'hui."
Le monde a vu hier sur Capitol Hill à Washington, DC que parfois certains Américains, pas tous, peuvent devenir un peu fous. Mais de temps en temps, les Américains font du bon travail. De temps en temps, ils sont motivés à donner un coup de main là où c'est nécessaire. Et qui sait? Peut-être que cela est fou aussi ... C'est certainement plus facile quand quelqu'un appelle à l'aide, de prétendre que nous n'avons tout simplement pas entendu.
Plus que cela à dire à l'instant? : No Comment.
-------
"Je n'habite pas la Californie.
J'habite à Stavelot, où les choses vont de mieux en mieux."
Il s'agit bien plus que d'attendre simplement un vaccin. Le nombre de personnes activement malades dans le monde augmente à un rythme alarmant. Si les choses semblent tranquilles aujourd'hui où nous sommes, c'est le meilleur moment pour se préparer localement. Faisons-nous cela?
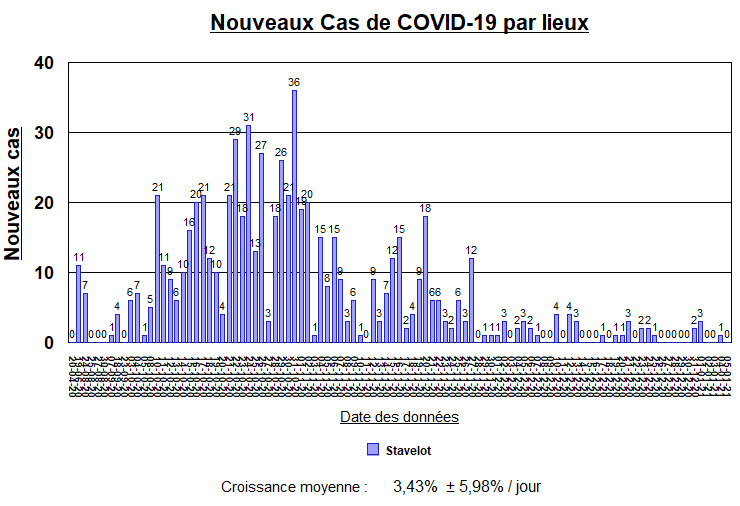
Car 3,43% n'est pas 0%. Le virus passe parmis nous pas comme une armée, mais comme un espion.
<<<< Home


Are we sure that Goebbels is dead ? Or did he emigrate to the country where Woodrow Wilson was, before him, an excellent developer of American propaganda. Read the book "Fake News" (published 1920).