Q et R/ Q & A
Je suis vacciné. Puis-je oublier de porter le masque?
CoronaSTAVELOT.com
Thanks for visiting!
To translate this page, select your
language from the dropdown menu below:
Voici les réponses rassemblées de la litérature scientifique par le New York Times ce jour.
Il n'y aura pas de correspondance parfaite avec les informations dans un pays comme la Belgique, où seulement 9% ont été vaccinés. (Rappelez-vous que l'objectif est d'atteindre au moins 70% de la population vaccinée pour éliminer la transmission virale). Mais cette information est fournie avec l'espoir qu'elle amène le lecteur à réfléchir dans la bonne direction. Il est également utile en ce qu'il rappelle ce qui n'est pas encore connu et reste donc sans réponse pour le moment.
---------
(le traducteur ci-dessus peut vous venir en aide!)
|
As more and more Americans get vaccinated, many are wondering when they can throw out their masks. |
|
The answer, my colleague Apoorva Mandavilli reports, largely depends on two factors — how quickly Covid rates drop and what percentage of people remain unvaccinated in your community. |
|
Scientists still don’t know if vaccinated people can spread the virus to the unvaccinated. While the vaccines work well in preventing severe illness and death, data is still missing on how well they stop the virus from taking root in an immunized person’s nose, where it could be spread to others. |
|
If some previous vaccines are a guide, then we may have to live with masks for a while longer. Inoculations against the flu, rotavirus, polio and pertussis all prevent severe disease, but not infection. |
|
Virus variants are also changing the calculus, since some vaccines are less effective against some of them — and at least one variant discovered in Brazil may be able to reinfect those who recovered from an earlier version of the virus. |
|
Still, early research suggests the vaccines do cut transmission. Experts say that an 80 percent drop in transmissibility might be enough to allow vaccinated people to ditch masks, especially if most of the population is inoculated. But with stubbornly high infection rates across the country, and with only 26.2 million people fully vaccinated and 51.8 million having received a first shot, experts say that those who are immunized must continue to mask. |
|
And finally, how would a stranger be able to trust that an unmasked person had actually been fully vaccinated? (Especially when mask skepticism appears to still be prevalent in some pockets of society.) |
La réponse va changer avec le temps bien sûr. Plus qu'on peut préciser le taux d'infection dans une région, et le plus de personnes vaccinées, mieux sera la précision de la réponse.
Vos réponses à notre Questionnaire n°1
F :
Voici les réponses que nos lecteurs on donné à ce Questionnaire sur le confinement pendant cette periode de pandémie.
Merci pour vos réponses. Cliquez sur ce lien pour ouvrir les réponses en format PDF.
Comme pour tout sur ce site (y compris les graphiques et les images) copiez et distribuez tout ce qui vous plaît ou répond à vos besoins.
Comme promis: pour ceux qui ont fourni leurs adresses e-mail, celles-ci ne sont bien sûr pas incluses dans ce rapport de résultats. Ceux-ci seront utilisés pour envoyer des copies personnelles des réponses.
2.139 visites sur notre site. 26 réponses. Un taux de réponse de 1,22%.
Growth Factor Analysis, to see where this is headed, and when ...
E :
Another great question from our Questionnaire ...
Goal: to assess day by day, how quickly a viral illness is growing in a population.
A few equations, and a bit more explanation.
-
Here's how a Growth Factor is Calculated :
Growth factors are quite easy to calculate, as long as one gets the order right.
Here is an example from our current work on April 5th with cases of COVID-19 in Belgium.
The Growth Factors are in the pale blue column, one day after the next ...
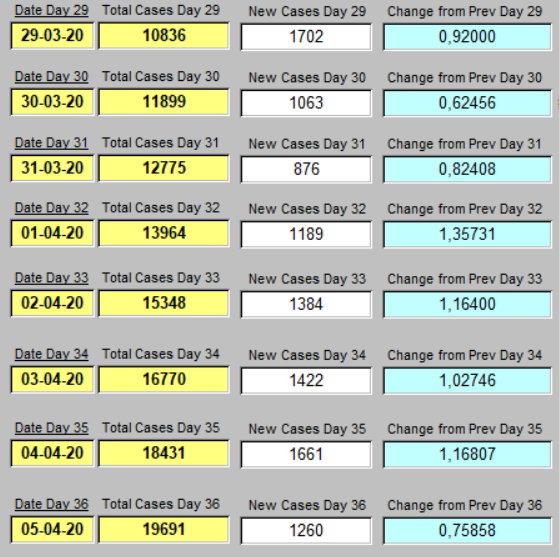
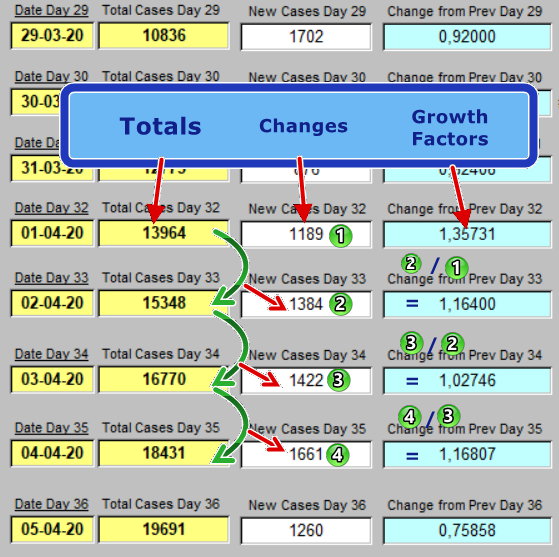
Let's label these columns :

We will take Today's Total Reported cases, and subtract the previous day's Total Cases.
The result we'll call New Cases for today. Example : on 04-04-20, 18431 Total Cases - 16770 the previous day, yields 1661 New cases on that same date.
The same has been done for the other values in this example. Quite logically, today's Total Cases, minus yesterday's gives today's New Cases. Should one use the new cases reported by Public Health instead? No, use these. The progression here depends on changes in the Total Cases. Reported New Cases will have too much variability to be as useful.
Next, and we've used stick-on green numbers to help follow the process ... On 04-04-20, #4 is divided by #3. That's 1661 / 1422, to compare one growth period with the previous one. 1661/1422 = 1.16807, and that is the growth factor for 04-04-20. Looks like a small number with too many decimal places. But in fact, each value has been compounded on the previous value since March 1. And that is how one winds up, in a short time, with 19,691 Total Cases reported by Public Health.
To better understand, simply say to yourself now: "Amaing, but true."
Each day that a value for Total Cases is added, the same process is carried out, comparing rate of growth with that of the previous day. And yes, it can be a value less than one. That's even desireable.
So for 05-04-20: 19691-18431 = 1260 New Cases. The Change from the previous day is given by 1260 / 1661 = 0.75858. That's the Growth Factor on 05-04-20. A value < 1, suggesting non-growth, or more accurately, a reduced rate of growth since Total Cases did in fact increase from the previous day.
2. Then what?
As time goes on, if cases are continuing to grow exponentially in number, it would be good to have a mean (some say average) for all these values over time, right up to today. Think of it as the big picture view. A look at the forest over time, rather than each individual tree we come upon.
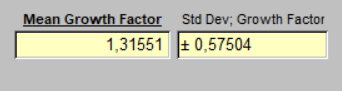
One can present this with a standard deviation and confidence limits. Today's value looked like this, with values averaged since March 1, 2020 : the mean Growth Factor is 1.31551±0.57504. With 90% confidence, it's between 1.156 and 1,475. It is >1. Not = 1 or < 1. So it represents a period of exponential growth in the cases of COVID-19 in Belgium from when that bug first arrived.
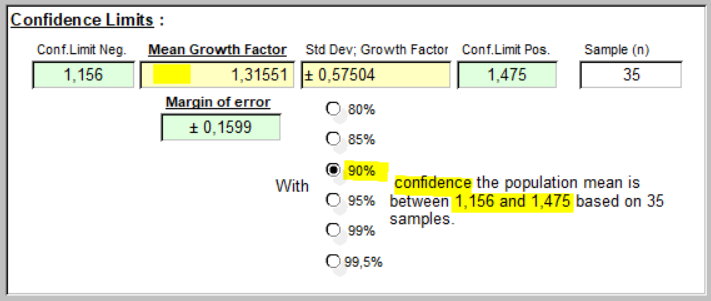
And taken as an average, it means that exponential growth is still going on, since this growth factor is greater than 1.0. At 1.0, growth has reached the inflection point, and may begin to decline. This value represents the events since March 1 to now: an overview. Conclusion: this period overall was one of exponential growth. It says nothing about this past week. It speaks to the entire period. (There; Now I've said it again).
3. Let's explore other mathematical descriptions of such growth, then specifically relate this growth factor to predicting what Total Case load may be present on some day in the future. But first, the key question: is this darned infection still spreading or not?
The spread of infection depends on many variables.
But two important ones are :
-
- the average number of people that an infected person comes in contact with each day;
- the probability of each exposure becoming an infection. (a single sneeze may not get the job done for the virus).
Let's abbreviate #1 as 'E' for exposure, and #2 as 'p' for probability.
Let's define No (N zero) as Number of Total Cases counted on the day when we began following this process, (that's the zero, for day 0).
We will be interested in seeing how many Total Cases there will be at some point in the future.
Since this is exponential or geometric growth as cases spread, there will be a number of Total Cases at some day in the future. That will be the Number of Total Cases on day Nd, where 'd' is that future day number. Say, for example, in 14 days, but on any given day in the future one would like to look at.
That value for Nd, starting from No, will of course depend on 'E' number of contacts, and 'p' which represents just how transmissible this viral illness actually is. Since this pattern of growth compounds each new value on the previous values, increases will happen between days, but raised to the power of 'd'. ('d', as said, the day you are interested in in the future).
That looks like this : [ Nd = (1 + E · p)^d · No ] , or if you prefer a graphic thing ...
![]()
What seems to be missing here is the term (1 + E · p).
But in fact, (1 + E · p) = our growth factor. ... Wow!
And now quite simply, for any date in which we have calculated the growth factor as we did above,
we can get to a value for (E · p). Why do that?
Because (E · p) is the magnitude of what determines infections.
The virus is loking for ways to increase (E · p) : more still uninfected contacts. Ways to increase the chance that an infection will happen (mutations that increase this probability), but even simpler than that, a setting in which people don't use masks, gloves, or handwashing. And at that house, 'p' for probability shoots up.
And of course, all public health measures are aimed at reducing the value of (E · p) : from social distancing to covering your sneeze, to washing your hands. There was a coronavirus there on that door handle, ready to go, but you clobbered it just in time with your spray of 1.5% bleach. And by staying home alone, away from those already infected, you reduced the 'E' for exposure to contacts, essentially to 0 if you're being serious about this.
4. Here's where we're going with is...
We have everything we need each day, to be able to calculate a value for (E · p).
We don't even need to take (E · p) apart any further to get to 'E' or 'p'.
We have a Growth Factor, and [Growth Factor - 1 = (E · p) ].
We will be able to calculate a mean value of (E · p) over a given time period. It sort of answers the question: "Just how risky is it out there, anyway?"
We will be able to compare several mean values of (E · p) over specific intervals of time, to see if they are different, or not really different at all.
Whatever is being done in a society to reduce levels of viral propagation, these should theoretically be reflected in (E · p).
If a government implements a public health policy, or amends it from a prior approach, (E · p) should teach us whether it's effective, made no difference, or was accompanied by things getting worse.
Now you've had your introduction.
Next we'll apply these principles to our Total Case data, from March 1 to April 5. We'll be looking to see how much impact government imposed sanctions and recommendations, as carried out in Belgium, have had on that measure of infectivity, (E · p).
Yes, please. Take me to that exciting derived (E · p) data and it's analysis.
(E · p) : an indicator of progress or stagnation
If you have not read the previous article, you may feel like you fell into the middle of something, because you did. We recommend reading it first.
A page with all the calculated values of Growth Factors, and the derived values of (E · p) is found at this link. It's for those who like to have all the numbers in front of them.
Here are several mean values of (E · p) during different intervals of time.
I have annotated these to assist with comprehension ...
First, the mean Growth Factor calculated March 1 to April 5.
Quite simply, during this period of just over a month, exponential growth was the situation, on average.
This is the starting point for determining (E · p), since the Growth Factor - 1 = (E · p).
During that same time period the mean value of (E · p) was as follows :
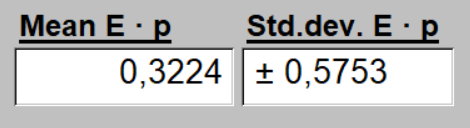
Do not be too concerned about units of measurement here. One can think of (E · p) as a measure of infectivity and transmission combined.
It would be expected to correlate with the prevalence (cases per million population) of the disease.
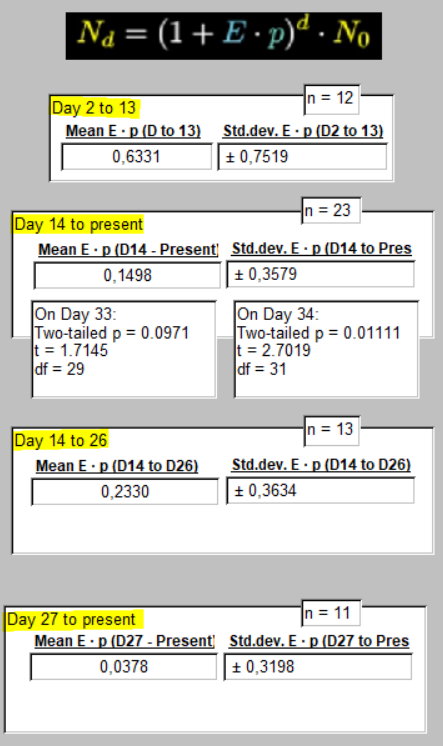
Day 2 to 13 were days before the implementation of school closures and limitation of gatherings. Outdoor gatherings were initially limited to 10,000 people max at this point. It is a time of exponential growth of the COVID-19 illness in this country and the world.
Day 14 to the present (April 5) represents the interval after all measures had been put in place. These were initiated in a stepwise fashion. Eventually non-essential business closings and other methods of confinement to home, non-visiting of at risk populations, and supportive hygiene methods were put in place. They are currently awaiting revue on April 19th to address their possible prolongation. Student's t-test was used to compare means from Day 14 to 33 with the Day 2 to 13 value. This just missed significance, but by Day 34 a p value = 0.011 supported the idea that the value of 0.1498 was sigificantly lower than the 0.6331 mean for the pre-restrictions period.
Days 14 to 26 and 27 to the present, both represent the same measures of social confinement, hygiene, closed borders, non-essential travel restrictions. They are subsets, one earlier and one later. The first a sample of 13 days, and the second, 11 days.
The mean value of (E · p), again taken as representing viral transmission events has obviously diminished during the second subset period. But the standard deviations suggest significant variability from day to day, and as seen in the raw data. These distributions are platykurtic. (Wow! Go ahead, Google that. I dare you).
A comparison of these means using Student's unpaired t-test, generates the following :
A two-tailed value of p = 0.2027; t = 1.3131; df = 22. So this apparent difference in means is not statistically significant at the 0.1 or 0.05 level.
Comparing the mean (E · p) of the pre-restriction period of Day 2 to 13, 0.6331 ± 0.3579, with this last mean (E · p) from Day 27 to the present, of 0.0378 ± 0.3198 determines a two-tailed value of p = 0.0242; t = 2.4286; df = 21. So the difference in means is significant at the 0.05 level and below. (Translation: 2.4 chances out of 100, that this apparent difference is real, and not just a fanciful whim of a coronavirus).
Trend in Growth Factors (Taux de Croissance) during the pandemic spread of COVID-19 in Belgium
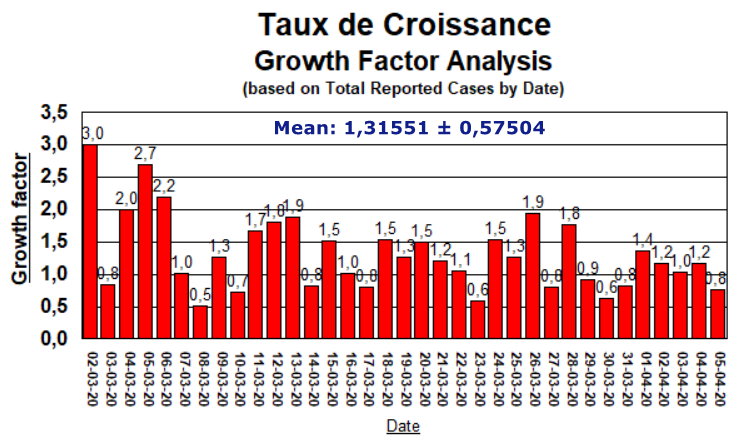
Seems like we're headed for that magical 1.0 feeling ... Hurrah!
Variation in SARS-CoV-2 Transmission & Infectivity (E · p) in Belgium March 2 to April 5, 2020

Conclusion :
Currently implemented practices in Belgium for reduction of transmission of the SARS-CoV-2 virus, are statistically distinct from the setting before their implementation. This has been true, not right from the start of confinement, and other measures, but since Day 34, 28 March, 2020. (Not that long ago).
Since Total Cases are still increasing as shown below, continuation of measures to reduce contact, 'E', (through social distancing) and transmissibility, 'p', (through use of masks, hygienic measures, and control of surfaces), still seems clearly indicated at this time. Results are encourageing and need to be supported and maintained until the Growth Factor remains below 1.0 for at least 14 consecutive days in the case of this particular virus.

Une question sur la vitesse et certitude d'effet du confinement. Comment savoir?
(in English below. When you start to understand what you're reading, that's the English part).
F :
Hier, j'ai reçu une bonne question.
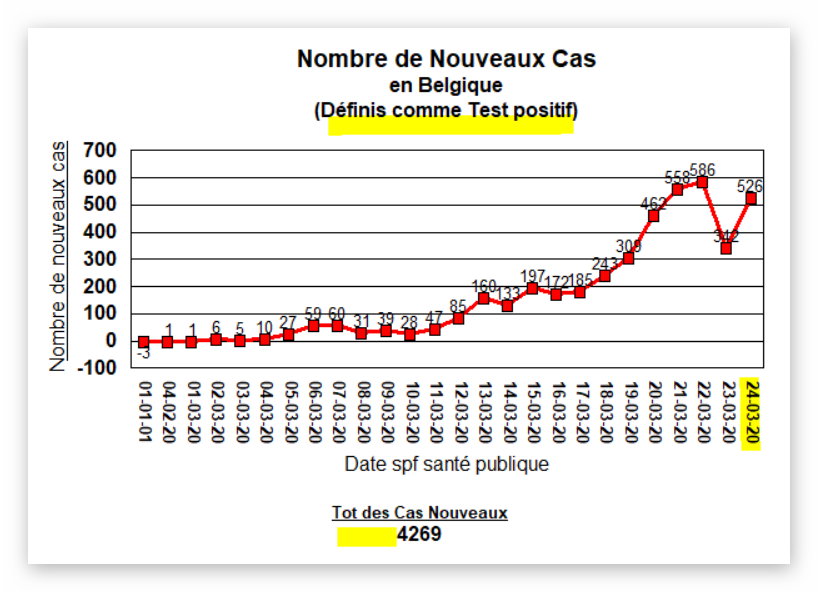
Elle a été proposé après un examen de graphiques comme celui-ci:
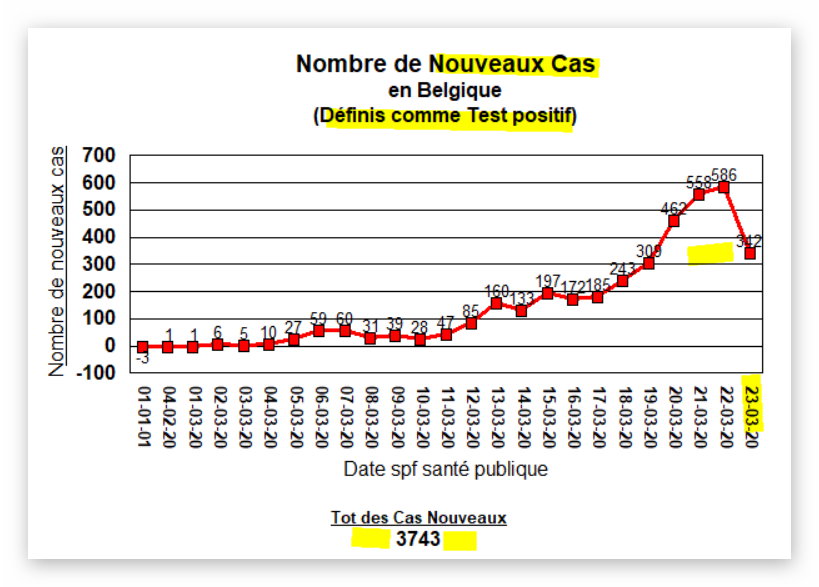
Voici le même graphique avec la nouvelle valeur d'aujourd'hui.
Si les données d'hier soulevaient une question, qu'en est-il aujourd'hui?

L'effet observé sur le graphique reflète les données de SPF Santé publique. Il est important de dire que ce sont leurs données, non modifiées. Un autre concept important est lié à la question: qui testons-nous? Puisque "un cas" est plus précisément "un test positif", pourquoi est-ce important? Le virus infecte aussi, bien sûr, les personnes qui ne sont pas testées que ceux avec un résultat positif. Ils ne font donc pas partie de l'échantillon quotidien du SPF Santé publique. Acceptons donc que les données reflètent 1 / 8ème à 1 / 10ème du total réel de la population infectée. Nous acceptons également qu'il s'agit d'un échantillon du groupe plus large, mais large assez pour être de valeur. Il ne faut pas oublier que l'échantillon n'est pas tous les cas d'infection. Mais il ne faut pas sous-estimer sa valeur.
La croissance virale, et sa transmission lorsqu'elle est sans opposition, et comme vous l'avez entendu, est exponentielle, augmentant géométriquement, et non le long d'une ligne droite. D'autres choses dans la nature (et la finance) se développent de cette façon. Ainsi, prendre toutes les données telles que rapportées, jour après jour, permet de calculer un taux de croissance d'un jour à l'autre. Cela varie. Il a une valeur moyenne et un écart type pour cette croissance. Les deux peuvent être calculés.
Hier, la diminution observée ( et bienvenue ) dans les données graphiques était associée à une augmentation moyenne de 1,327 ± 0,557 cas totaux par jour, mesuré depuis début mars. À ce jour, le 2 mars, 8 cas au total cumulés, et présenté par SPF Santé publique. Cette croissance de 1,327 peut sembler petit, mais elle est puissante car elle est cummulée sur le résultat précédent. Jours après jour.
Le changement du 22 au 23 mars a connu une augmentation de 0,584. Une petite augmentation, quoique inférieure au chiffre moyen donné ci-dessus. Ce changement n'était associé qu'à environ 7 à 10 chances sur 100 essais, d'avoir eu lieu par hasard. Donc, probablement réel. Tous ces calculs précis dépendent des données d'entrée fournies, étant de bonnes données. Les «bonnes données» signifient ici qu'elles sont représentatives de la distribution des événements que nous mesurons. Cet événement que nous voulons mesurer est la présence de maladies virales dans la communauté, et pas seulement les tests positifs, comme déjà dit. Les pratiques de test varient énormément dans le monde. Ils varient en Belgique par Région. Bien que cela puisse être regrettable, ce n'est la faute de personne. Nous sommes tous encore sur la partie abrupte de la courbe d'apprentissage pour savoir comment aborder cette maladie efficacement. En Wallonie, moins de labo = moins de tests.
Votre question se pose dans ce cadre qui est tout sauf simple.
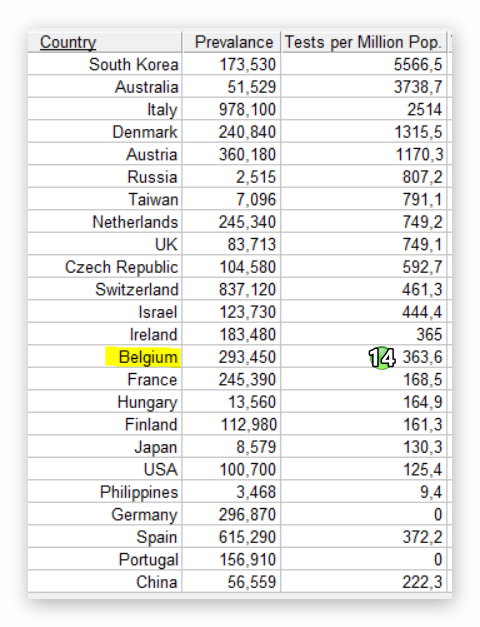
Le tableur ci-dessous indique le nombre de tests effectués par pays, dans le format habituel: tests par million d'habitants. Beaucoup d'approches différentes aux tests. Nous pouvons voir qui sont les plus forts pour faire des tests. Pas toujours en parallel avec la prévalence (cas par million) de la maladie.
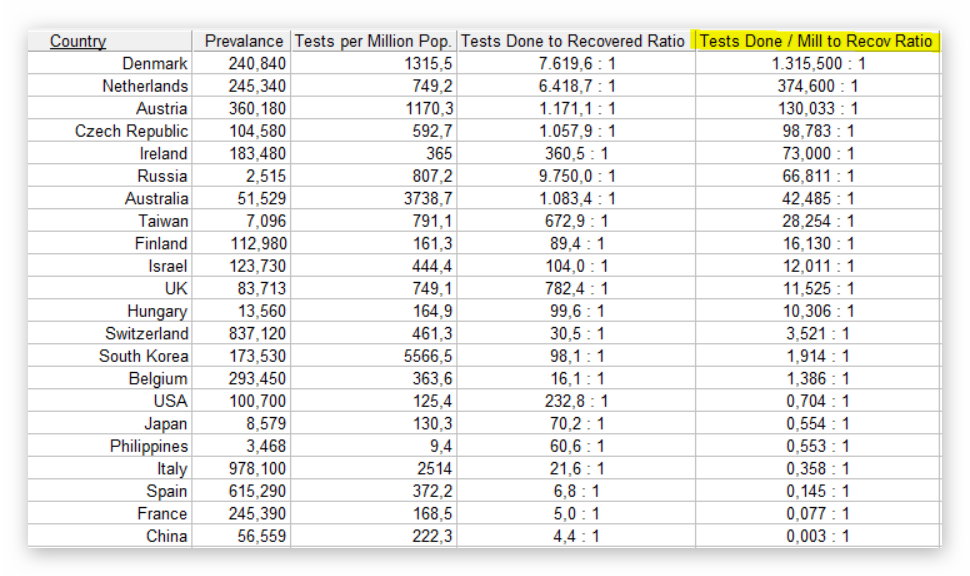
Le tableur ci-dessous montre le nombre de tests effectués par pays, mais par rapport à chaque patient récupéré. Combien de tests un pays fait-il pour arriver à 1 patient guéri? Cela varie énormément. Et non, je ne propose pas que les tests guérissent la maladie. Mais ils la découvrent.
S'il existe ici un lien avec notre sujet actuel, c'est qu'il sera très difficile de séparer les effets de l'éloignement social, l'hygiène, etc., de l'impact des approches aux tests, pour choisir un exemple.
Plus de Police en rue, plus on découvre des crimes. (Non, je n'ai pas dit, commit par la Police!)
Plus de tests, plus de COVID-19. Et cela à un effet sur les résultats présentés par SPF Santé publique chaque jour.
Lorsque nous appliquons tout cela au résultat d'aujourd'hui (voir le graphique), notre première réaction pourrait être: la courbe n'est pas descendue plus loin. Deuxième réaction: elle n'est pas remontée aussi haut qu'il y a quelques jours. "Alors, c'est mieux?" Mais est-ce dû à toutes les mesures sociales ou pas?
Il convient également de rappeler ici une expression que ceux qui traitent avec les nombres utilisent: «Garbage In, Garbage Out». (Ordures en entrant. Ordures en sortant). Cela ne doit pas être pris comme une insulte. C'est juste un fait. Parfois, des choses étranges arrivent aux chiffres. Et personne ne le remarque. Donc, tous les calculs et statistiques du monde ne peuvent pas vous donner un bon résultat si les données d'entrée sont erronées. Sont-ils défectueux ici? Ou un peu défectueux? Je ne sais pas. C'est à SPF Santé publique de poursuivre rapidement et de prendre les mesures nécessaires si indiqué.
Si les résultats et ces courbes deviennent subitement bizarre, cela ne veut pas dire qu'on a plus de s bons chiffres. Peut-être qu'on a simplement pas encore la bonne explication pour comprendre les résultats.
Le calcul du taux de croissance des maladies virales ici, dépend du total cumulé des tests positifs, et non des «nouveaux cas» au jour le jour. Il utilise la modification du nombre total de cas pour calculer une valeur "comme si" pour les nouveaux cas. Et en comparant cela avec cette valeur la veille, donne le taux de croissance. Le taux de croissance actuel de hier à ce jour, est donc de 1,53801.
Est-ce une catastrophe qui s'approche?

Comparons ce nouveau taux d'augmentation avec la moyenne et l'écart type d'hier: c'est ce qu'on appelle un test Z (ou Note Z). Sa valeur est ici de 0,37781. Ne vous inquiétez pas du calcul. Il nous indique que cette hausse soudaine se situe à moins de 1 écart-type au-dessus de la moyenne. Quelle est la probabilité que caché quelque part dans cela, un fait important?
Une valeur de probabilité, p, serait utile. C'est p = 0,352678. Donc? Il y a 35 chances sur 100 que toute cette impression d'augmentation (ou de diminution) évidente ne soit que cela: une impression.
Une application moins gênante mais très utile du calcul du taux de croissance consiste à voir quand toutes les ressources disponibles seront épuisées: Comme les lits d'hôpitaux et aux soins intensifs. Aujourd'hui, ça va encore. Les hôpitaux sont à 1,35% de la pleine capacité et lits de soins intensifs à 12,2% de la capacité également. ... ça va encore. Mais l'intuition est un mauvais estimateur de l'intérêt composé comme de la croissance virale et sa transmission dans le peuple. L'intuition dans cette situation a tendance à nous placer loins à l'arrière du peloton dans cette course contre la montre. Bien sûr, si les mesures sociales fonctionnent, cette course peut être abandonnée, peu importe notre retard et position à la fin.
Il est donc préférable de comparer le taux de croissance au fil du temps. Je publie les données réelles de SPF Santé publique ici, car les gens aiment les voir. (Au moins quelques âmes dévouées, il me semble!). Mais, comme votre question l'a prouvé, elle n'apporte pas toujours de la clarté à notre situation. Et tenez plutôt à regarder davantage l'évolution du nombre total des cas, plutôt que les nouveaux cas, jour après jour.
Déposons un peu notre calculatrice, et parlons de cette nuisance de virus.
La maladie virale que nous appelons COVID-19 a une période d'incubation, en moyenne, de 5,1 jours. Cela signifie que lorsqu'une personne devient contaminée par ce virus, il faudra en moyenne 5,1 jours avant que cette personne ne commence à tomber malade.
Les types médicaux aiment toujours publier des exceptions, devenant ainsi célèbres mais généralement pas riches. Cette période d'incubation pourrait donc être de 14 jours. (D'où vient sa période de quarantaine). Pourrait même aller jusqu'à 27 jours. Mais c'est très, très rare. Donc: 5 jours.
Beaucoup de données existe déjà pour le prouver. Pas seulement un résumé général sur la «maladie virale», mais sur ce virus: SAR-CoV 2. Au cours de l'incubation, selon toute vraisemblance, d'autant plus que l'on se rapproche du cinquième jour, le plus faclement que l'on le transmet involontairement à toute personnes disponibles pour le recevoir. Et par personne infectée, c'est une valeur de R0 = 2,3, qui en français veut dire la personne risque d'infecter 2,3 personnes. Je ne sais pas à quoi ressemble trois dixième d'une personne, mais passons. Pour la grippe, c'est 1,3 = beaucoup moins transmissible ou infectieux que notre nouvelle connaissance, coronavirus.
Nous voici donc tous enfermés. Prisonniers du virus.
Mais ce pauvre petit virus a un problème. S'il ne parvient pas à trouver la personne suivante à infecter d'ici 5 jours (en moyenne), il va simplement mourir et disparaître. Et là, vous venez d'apprendre un principe clé qui guide tout ce que nous faisons maintenant, avec nos nouvelles habitudes.
Les mesures d'isolement, draconiennes et moins, sont basées sur cela. 5 jours.
Et maintenant, enfin, pour répondre à votre question.
Une augmentation du nombre total de cas viraux après le début de ces mesures d'isolement doit signifier qu'elles n'ont pas fonctionnées. Pour mieux dire : Elles n'ont pas encore fonctionnées.
Je pense que sauter sur une légère baisse de ces cas est motivé par un espoir, que je comprends et sympathise avec. Mais l'annoncer comme tel, n'est pas seulement une erreur d'un point de vue statistique, mais d'un point de vue médical et de santé publique. Cela risque d'amener des gens, dont beaucoup en ont déjà assez de leur privation de liberté, à sortir et à célébrer avec des amis.
Je pense que ce serait prématuré. Le virus infecte également en grappes ou bandes. Voilà le problème en Italie. Des grappes ("clusters" en anglais) dans une population âgée (5e plus âgée mondialement).
La mesure dans laquelle les efforts mis en œuvre que vous avez mentionnés seront efficaces dépendra également de leur mise en place là où il y a actuellement plus ou moins de regroupement des cas viraux: des défis plus grands et parfois plus petits pour l'encourager à disparaître, pendant qu'il est occupé à chercher sa prochaine habitation.
Pour placer ces données ici à Stavelot et les utiliser pour répondre à la question que vous avez posée, il est sage de commencer par regarder plus loins dans le monde. Cela enseigne aujourd'hui, le 24 mars, que malheureusement les malades actifs de cette maladie continuent d'augmenter dans le monde (16,6% depuis hier). Si la Belgique pouvait déjà être le maître de ce virus, ce serait formidable. Regardons autour de nous et voyons si cette idée est soutenue ou pas aujourd'hui.
Mais n'oublions pas non plus de noter que ceux qui sont guéris de COVID-19 continuent également d'augmenter chaque jour, mais éclipsés par l'augmentation des cas actifs. N'oublions pas que là où cela a commencé en Chine, 89,9% se sont à ce jour, rétablis. Abandonnez l'idée qu'ils inventent ces chiffres.
Ne gaspillez pas d'énergie émotionnelle dans un reportage qui pointe dans une direction inutile vers un rapport anecdotique d'une catastrophe potentielle que personne n'avait anticipée. Les médias font ce qu'ils font le mieux, et de pire: mais il continue de vendre et de coopter votre attention dans des petites fenêtres qu'ils savent tout le monde regarde. Arrêtons de faire ça.
Les Chinois ont fait un excellent travail pour documenter comment tout cela s'est comporté dans leur pays. Nous devons apprendre de cela et l'appliquer. Il n'y a pas de temps pour réinventer la roue anti-COVID-19.
Certains diront: "Oui, mais moi et mes voisins ne seront tout simplement pas séparés de nos familles et placés dans des camps comme des réfugiés. Nous ne le ferons tout simplement pas."
Ensuite, ceux qui nous donneront des directives devront trouver un moyen de le faire mieux. Dans un style Belge, si cela vous plaît.
Alors, qu'est-ce qu'une personne raisonnable va faire? Eh bien, n'entrez pas en contact avec le virus.
Une réponse aussi simple que compliquée. Qu'il devienne ce virus, et pas triste à dire, un virus sans-abri. Un V.S.D.
Si jamais j'ai un peu plus de temps (imaginez: être à la retraite et ne pas avoir assez de temps?), Je vais essayer de contribuer ici à résumer ces mesures. Donner des suggestions et des rappels quotidiens si essentiels au développement de nouvelles habitudes anti-virales. Vous en avez déjà vu et entendu la majorité.
Avez-vous déjà pensé que vous développeriez un intérêt à vous parler (par téléphone ou par e-mail, mais pas en personne) de la durée de vie du virus SAR-CoV 2 sur les surfaces de votre maison? Eh bien, nous y voilà.
Á apprendre et mémoriser, notre leçon de science pour cette journée.
Ou au lieu de cela, peut-être abandonner toutes ces mesures d'isolement gênantes, et laisser le virus rendre tout le monde malade et en finir avec ça? Comme les Pays-Bas et le Royaume-Uni se sont lancés à faire ces derniers jours. Je ne suis pas assez épidémiologiste pour y répondre utilement sur leurs décisions. Ce ne serait pas mon prochain choix.
Alors ici sur ce site, je vais essayer de fournir chaque jour des mises à jour du taux de croissance.
Sans tous ces mots. Promis.
Et nous apprendrons ensemble au fil du temps si notre emprisonnement et notre hygiène obsessionnelle ont aidé ou non.
Quand sa moyenne descendra constamment en dessous de 1 à 1,5 écart-type en dessous des valeurs ces derniers jours, tout ce séjour à la maison aura valu la peine.
J'espère que je suis proche d'une réponse à votre question. Faites le moi savoir ci-dessous.
------------------
N'oubliez pas de répondre à notre questionnaire très court et très rapide.>>>>>
E :
Yesterday, someone asked a good question.
It was proposed after a review of graphs like these below: They represent new cases of COVID-19 in Belgium per day, by date. Or more accutately, number of positive tests.
The numbers have started to jump around a bit.
"Q : Is this due to washing our hands more and closing schools?"

Here is the same graph with today's new result (526 new cases) added.
If yesterday's data raised a question, what about today's ?
Here was the question :
"The hygiene measures campaign really started on March 1 and the first isolation measures on March 12 (suspension of classes, in particular) in our country. If the trend shown by your graph is confirmed, can we consider that this is due to their effect, twenty then ten days later?"
The "effects" seen on these graphs presents the data of FPS Public Health. It's important to say that these are their data, unmodified. Another important concept is related to the question: who are we testing? Since "a case" is more accurately "a positive test," why is that important? The virus of course, is infecting as well, people who aren't being tested. So they are not in the daily sample at FPS Public Health.
So let's accept that the data reflect 1/8th to 1/10th of the actual infected population total. We also accept that it is a sample of the larger group, and so of value. Not to be simply dismissed.
Viral growth, and its transmission when unopposed, and as you have heard, is exponential, increasing geometrically, and not along a straight line. Other things in nature (and finance) grow in this way. So taking all of the data as reported, day after day, allows one to calculate a rate of growth from one day to the next. It varies. Sometimes even a decrease instead of the usual increase. It has a mean value, and a standard deviation for this growth. Both can be calculated.
Certain results obtained, even suggest the possibility of a decline from one day to the next as mentionned.
Yesterday, the welcome downturn seen in the graphed data was associated with an average increase of 1,327±0,557 total cases per day. That may seem small but it's powerful because it is compounded on the previous result, day after day. The change from the 22nd to the 23rd of March, had an increase of 0,584. A small increase, though less than the average figure given above. That change was associated with only about 7 to 10 chances in 100 tries, of having happened by chance. So, probably real.
All of these precise calculations depend on the entry data provided, being good data. "Good data" here means that it is representative of the distribution of events that we are measuring. That event that we want to be measuring, is the presence of viral illness in the community, not just positive tests, as already said. Testing practices vary tremendously around the globe. They vary in Belgium. While this may be unfortunate, it's no one's fault. We are all still on the steep part of the learning curve in how to approach this disease effectively. Your question arises in that reality.
The spreadsheet below shows the number of tests done by country, in the usual format: tests per million population. Lots a different approaches to testing. We can see who the leaders are.

The spreadsheet below shows the number of tests done by country, but relative to each recovered patient. How many tests does a country do to get to 1 recovered patient? It varies tremendously. And no, I am not proposing that testing cures the disease.

If there is a link to our current topic, it is that effects of social distancing et cetera, will be very difficult to separate from the impact of approaches to testing.
When we apply all that to today's result (see the graph) our first reaction might be: It didn't go down further. Second reaction: It didn't come back up as high as values a few days ago. So is that better? And is it due to all the social measures or not?
"How would you know?"
One should also remind here of an expression that those who deal with numbers use: "Garbage In, Garbage Out." That is not to be taken as an insult. It is just a fact. Sometimes, strange things happen to the numbers. And nobody notices. So all the calculation and statistics in the world can't give you a good result if the entry data are faulty. Are they faulty here? Or a little faulty? I don't know. That's up to FPS Public Health to quickly pursue and take necessary steps if indicated.
The calculation of the growth rate for viral illnesses here, depends on the cummulative total of the positive tests, and not the "new cases" day by day. It does use the change in total cases to calculate an "as if" value for new cases. Comparing that with the previous day, gives the growth rate. So today's growth rate is 1,53801. Is that a disaster in the making? Let's compare this new rate of increase with the mean and standard deviation from yesterday: that's called a Z-test. It's value here is 0.3781. Don't worry about the calculation. It tells us that this sudden rise is within 1 standard deviation above the mean.
What is the likelihood that hidden somewhere in this, is that this is a very important upturn after all is calculated, said and done? A p-value would help. It's p = .352678. So? There are 35 chances out of 100 that this whole impression of obvious increase (or decrease), is just that: an impression. That by convention is not considered a significant result, or a result outside of the average value.
A less bothersome but very useful application of the growth rate calculation, is to see when available resources will be all used up. Like hospital and ICU beds. Today, we're still ok. Hospitals at 1.35% of full capacity, and ICU beds at 12.2% of capacity as well. Still ok. But intuition is a bad estimator of compound interest and viral growth. It tends to leave one far behind in this race against time. Of course, if the social mesures work, this race can be abandoned no matter how far behind we were.
So comparing the growth rate over time is the way to go. I post the actual data from FPS Public Health, because people like to see it. (At least a few devoted souls, it seems!). But, as your question proved, it doesn't always bring clarity to this situation. And do tend to look more at the evolution in cummulated total cases, then the new cases day by day, as you, very kindly, review these data presented here.
Let's put down the calculator and come back to the virus.
The viral illness that we call COVID-19 has an incubation period, on average, of 5.1 days. That means that when a person "gets" the virus, it will be 5.1 days, on average before that person starts to get sick. Medical types always like to publish exceptions, thereby becoming famous but usually not rich. So that incubation period might be 14 days. Might even go up to 27 days. But that is very, very rare. So: 5 days. Lots of data to prove that. Not just a general summary statement about "viral illness," but about this virus: SAR-CoV 2. During this incubation, in all likelihood, especially as one gets closer to the fifth day, one is unwittingly transmitting it to anyone available to receive.
So here we are, all locked up. Prisoners of the virus.
But that poor little virus has a problem. If it can't find one next person to infect by 5 days (on average) it's going to just die and go away. And there you have just learned a key principle that guides all that we are now doing, with our new habits.
So isolation measures, draconian and less so, are based on that. 5 days. And now, finally, to answer your question. Seeing a growth in viral total cases after the measures have been initiated must mean that they haven't worked. Careful. They haven't worked yet.
I think that jumping on a slight downwards turn, out of hope I assume, and announcing it as such, is not only an error from a statistical point of view, but from a medical and public health perspective. It risks leading people, many of whom are already fed up with their privation of liberty, to go out and celebrate with friends.
I think that would be premature. The virus also infects in clusters. That's the problem in Italy. Clusters in an elderly population (5th oldest in the world). So how much the implemented efforts that you mentionned, will be effective, also depends on their being put into place where there is currently more or less clustering of the viral cases: greater and smaller challenges to encourage it to die out while it's busy seeking its next home.
To place these data here in Stavelot, and use them to answer the question you posed, it is wise to first look around the world. That teaches today, 24 March, that unfortunately those Actively Ill with this disease continue to increase around the world (16.6% since yesterday). If Belgium could already be the master of this virus, that would be great. Let's look around us and see if that fits today.
But let's also not forget to notice that those who recover from COVID-19 also continue to increase each day, but overshadowed by the increase in active cases. Let's not forget to notice that where this began in China, 89.9% have recovered. Drop the idea that they are just making that up. Don't waste emotional energy on a news story that points in a useless direction towards an anecdotal report of a potential catastrophe that no one had anticipated. They are doing what they do worst: but it continues to sell and co-opt your attention in little windows that they know you are looking at. Stop that.
The Chinese have done an excellent job of documenting how all this behaved in their country. We must learn from that and apply it. There is no time to re-invent the anti-COVID-19 wheel. Some will say: "Yes, but I and my neighbors just aren't going to be separated from our families and put in camps like refugees. We just won't." Then those who give us guidelines will have to find some way to do it better.
So what's a reasonable person to do? Well, don't come into contact with the virus.
It's that simple, and also, that complicated. Let it become, not sad to say, a homeless virus.
If I ever get a little more time (imagine: being retired and not having enough time?), I will try to contribute here to summarizing those measures. To give suggestions and daily reminders that are so essential to developing new habits.
Did you ever think you would develop an interest in talking to you friends (by phone or email, not in person of course) about how long the SAR-CoV 2 virus can live on surfaces in your home? Well, here we are. Memorising and learning our science lesson for this day. Each day, adding a bit of knowledge.
Or instead, perhaps abandon all these isolation measures and just let the virus make everybody sick and be over and done with it? Like the Netherlands and United Kingdom have embarked on? I'm not enough of an epidemiologist to answer that usefully. It would not be my next choice.
So here, I will try to provide updates each day of the growth factor rate. When it consistently gets below 1 to 1.5 standard deviations under values in recent days all this staying at home will have been worth it.
N'oubliez pas notre petit Questionnaire.
13 questions, 6 minute max sur l'effet de ceci sur nos vies >>>>>>>>