
(E · p) : an indicator of progress or stagnation
If you have not read the previous article, you may feel like you fell into the middle of something, because you did. We recommend reading it first.
A page with all the calculated values of Growth Factors, and the derived values of (E · p) is found at this link. It's for those who like to have all the numbers in front of them.
Here are several mean values of (E · p) during different intervals of time.
I have annotated these to assist with comprehension ...
First, the mean Growth Factor calculated March 1 to April 5.

Quite simply, during this period of just over a month, exponential growth was the situation, on average.
This is the starting point for determining (E · p), since the Growth Factor - 1 = (E · p).
During that same time period the mean value of (E · p) was as follows :
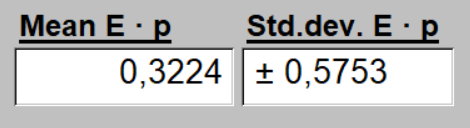
Do not be too concerned about units of measurement here. One can think of (E · p) as a measure of infectivity and transmission combined.
It would be expected to correlate with the prevalence (cases per million population) of the disease.
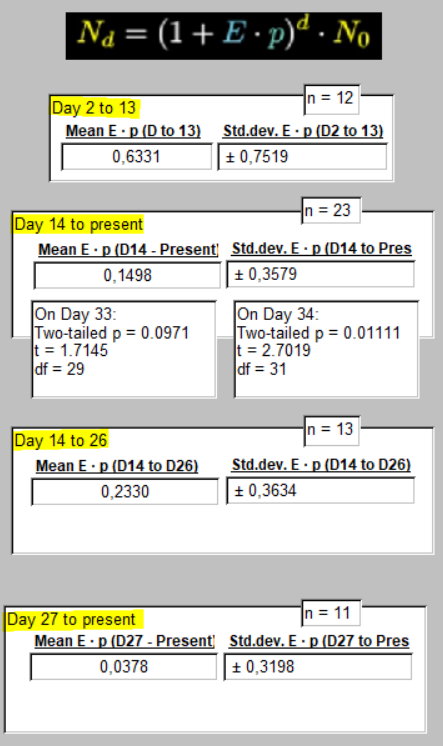
Day 2 to 13 were days before the implementation of school closures and limitation of gatherings. Outdoor gatherings were initially limited to 10,000 people max at this point. It is a time of exponential growth of the COVID-19 illness in this country and the world.
Day 14 to the present (April 5) represents the interval after all measures had been put in place. These were initiated in a stepwise fashion. Eventually non-essential business closings and other methods of confinement to home, non-visiting of at risk populations, and supportive hygiene methods were put in place. They are currently awaiting revue on April 19th to address their possible prolongation. Student's t-test was used to compare means from Day 14 to 33 with the Day 2 to 13 value. This just missed significance, but by Day 34 a p value = 0.011 supported the idea that the value of 0.1498 was sigificantly lower than the 0.6331 mean for the pre-restrictions period.
Days 14 to 26 and 27 to the present, both represent the same measures of social confinement, hygiene, closed borders, non-essential travel restrictions. They are subsets, one earlier and one later. The first a sample of 13 days, and the second, 11 days.
The mean value of (E · p), again taken as representing viral transmission events has obviously diminished during the second subset period. But the standard deviations suggest significant variability from day to day, and as seen in the raw data. These distributions are platykurtic. (Wow! Go ahead, Google that. I dare you).
A comparison of these means using Student's unpaired t-test, generates the following :
A two-tailed value of p = 0.2027; t = 1.3131; df = 22. So this apparent difference in means is not statistically significant at the 0.1 or 0.05 level.
Comparing the mean (E · p) of the pre-restriction period of Day 2 to 13, 0.6331 ± 0.3579, with this last mean (E · p) from Day 27 to the present, of 0.0378 ± 0.3198 determines a two-tailed value of p = 0.0242; t = 2.4286; df = 21. So the difference in means is significant at the 0.05 level and below. (Translation: 2.4 chances out of 100, that this apparent difference is real, and not just a fanciful whim of a coronavirus).
Trend in Growth Factors (Taux de Croissance) during the pandemic spread of COVID-19 in Belgium
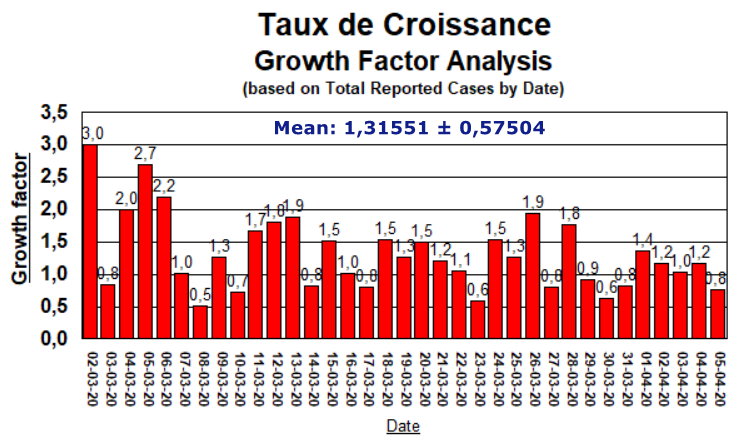
Seems like we're headed for that magical 1.0 feeling ... Hurrah!
Variation in SARS-CoV-2 Transmission & Infectivity (E · p) in Belgium March 2 to April 5, 2020

Conclusion :
Currently implemented practices in Belgium for reduction of transmission of the SARS-CoV-2 virus, are statistically distinct from the setting before their implementation. This has been true, not right from the start of confinement, and other measures, but since Day 34, 28 March, 2020. (Not that long ago).
Since Total Cases are still increasing as shown below, continuation of measures to reduce contact, 'E', (through social distancing) and transmissibility, 'p', (through use of masks, hygienic measures, and control of surfaces), still seems clearly indicated at this time. Results are encourageing and need to be supported and maintained until the Growth Factor remains below 1.0 for at least 14 consecutive days in the case of this particular virus.


Inscrivez-vous au blog
Soyez prévenu par email des prochaines mises à jour
Rejoignez les 15 autres membres