
Growth Factor Analysis, to see where this is headed, and when ...
E :
Another great question from our Questionnaire ...
Goal: to assess day by day, how quickly a viral illness is growing in a population.
A few equations, and a bit more explanation.
-
Here's how a Growth Factor is Calculated :
Growth factors are quite easy to calculate, as long as one gets the order right.
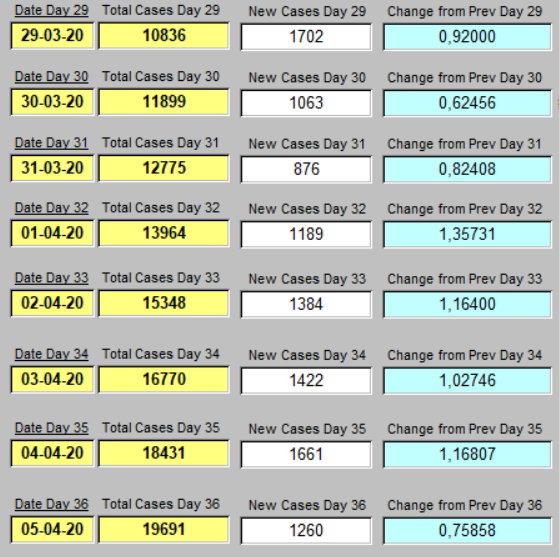
Here is an example from our current work on April 5th with cases of COVID-19 in Belgium.
The Growth Factors are in the pale blue column, one day after the next ...
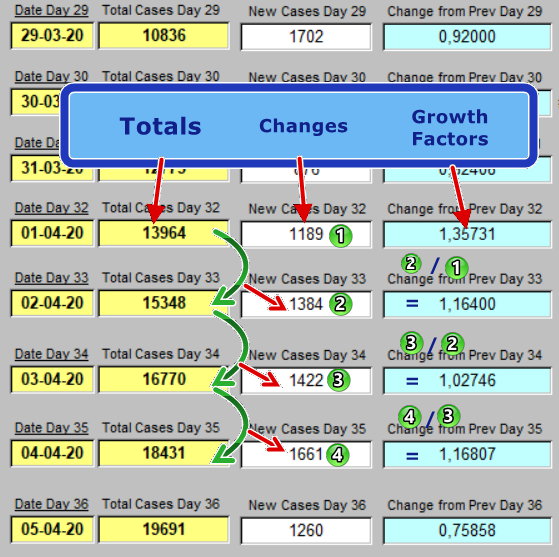
Let's label these columns :

We will take Today's Total Reported cases, and subtract the previous day's Total Cases.
The result we'll call New Cases for today. Example : on 04-04-20, 18431 Total Cases - 16770 the previous day, yields 1661 New cases on that same date.
The same has been done for the other values in this example. Quite logically, today's Total Cases, minus yesterday's gives today's New Cases. Should one use the new cases reported by Public Health instead? No, use these. The progression here depends on changes in the Total Cases. Reported New Cases will have too much variability to be as useful.
Next, and we've used stick-on green numbers to help follow the process ... On 04-04-20, #4 is divided by #3. That's 1661 / 1422, to compare one growth period with the previous one. 1661/1422 = 1.16807, and that is the growth factor for 04-04-20. Looks like a small number with too many decimal places. But in fact, each value has been compounded on the previous value since March 1. And that is how one winds up, in a short time, with 19,691 Total Cases reported by Public Health.
To better understand, simply say to yourself now: "Amaing, but true."
Each day that a value for Total Cases is added, the same process is carried out, comparing rate of growth with that of the previous day. And yes, it can be a value less than one. That's even desireable.
So for 05-04-20: 19691-18431 = 1260 New Cases. The Change from the previous day is given by 1260 / 1661 = 0.75858. That's the Growth Factor on 05-04-20. A value < 1, suggesting non-growth, or more accurately, a reduced rate of growth since Total Cases did in fact increase from the previous day.
2. Then what?
As time goes on, if cases are continuing to grow exponentially in number, it would be good to have a mean (some say average) for all these values over time, right up to today. Think of it as the big picture view. A look at the forest over time, rather than each individual tree we come upon.
One can present this with a standard deviation and confidence limits. Today's value looked like this, with values averaged since March 1, 2020 : the mean Growth Factor is 1.31551±0.57504. With 90% confidence, it's between 1.156 and 1,475. It is >1. Not = 1 or < 1. So it represents a period of exponential growth in the cases of COVID-19 in Belgium from when that bug first arrived.
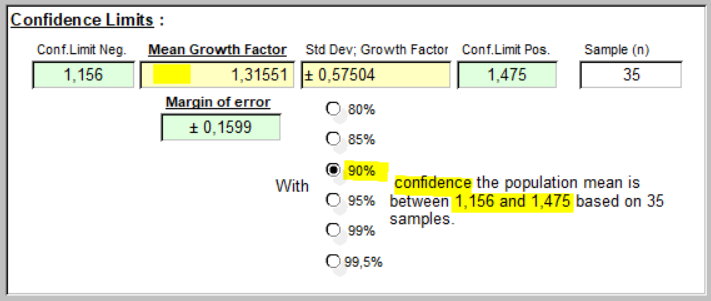
And taken as an average, it means that exponential growth is still going on, since this growth factor is greater than 1.0. At 1.0, growth has reached the inflection point, and may begin to decline. This value represents the events since March 1 to now: an overview. Conclusion: this period overall was one of exponential growth. It says nothing about this past week. It speaks to the entire period. (There; Now I've said it again).
3. Let's explore other mathematical descriptions of such growth, then specifically relate this growth factor to predicting what Total Case load may be present on some day in the future. But first, the key question: is this darned infection still spreading or not?
The spread of infection depends on many variables.
But two important ones are :
-
- the average number of people that an infected person comes in contact with each day;
- the probability of each exposure becoming an infection. (a single sneeze may not get the job done for the virus).
Let's abbreviate #1 as 'E' for exposure, and #2 as 'p' for probability.
Let's define No (N zero) as Number of Total Cases counted on the day when we began following this process, (that's the zero, for day 0).
We will be interested in seeing how many Total Cases there will be at some point in the future.
Since this is exponential or geometric growth as cases spread, there will be a number of Total Cases at some day in the future. That will be the Number of Total Cases on day Nd, where 'd' is that future day number. Say, for example, in 14 days, but on any given day in the future one would like to look at.
That value for Nd, starting from No, will of course depend on 'E' number of contacts, and 'p' which represents just how transmissible this viral illness actually is. Since this pattern of growth compounds each new value on the previous values, increases will happen between days, but raised to the power of 'd'. ('d', as said, the day you are interested in in the future).
That looks like this : [ Nd = (1 + E · p)^d · No ] , or if you prefer a graphic thing ...
![]()
What seems to be missing here is the term (1 + E · p).
But in fact, (1 + E · p) = our growth factor. ... Wow!
And now quite simply, for any date in which we have calculated the growth factor as we did above,
we can get to a value for (E · p). Why do that?
Because (E · p) is the magnitude of what determines infections.
The virus is loking for ways to increase (E · p) : more still uninfected contacts. Ways to increase the chance that an infection will happen (mutations that increase this probability), but even simpler than that, a setting in which people don't use masks, gloves, or handwashing. And at that house, 'p' for probability shoots up.
And of course, all public health measures are aimed at reducing the value of (E · p) : from social distancing to covering your sneeze, to washing your hands. There was a coronavirus there on that door handle, ready to go, but you clobbered it just in time with your spray of 1.5% bleach. And by staying home alone, away from those already infected, you reduced the 'E' for exposure to contacts, essentially to 0 if you're being serious about this.
4. Here's where we're going with is...
We have everything we need each day, to be able to calculate a value for (E · p).
We don't even need to take (E · p) apart any further to get to 'E' or 'p'.
We have a Growth Factor, and [Growth Factor - 1 = (E · p) ].
We will be able to calculate a mean value of (E · p) over a given time period. It sort of answers the question: "Just how risky is it out there, anyway?"
We will be able to compare several mean values of (E · p) over specific intervals of time, to see if they are different, or not really different at all.
Whatever is being done in a society to reduce levels of viral propagation, these should theoretically be reflected in (E · p).
If a government implements a public health policy, or amends it from a prior approach, (E · p) should teach us whether it's effective, made no difference, or was accompanied by things getting worse.
Now you've had your introduction.
Next we'll apply these principles to our Total Case data, from March 1 to April 5. We'll be looking to see how much impact government imposed sanctions and recommendations, as carried out in Belgium, have had on that measure of infectivity, (E · p).
Yes, please. Take me to that exciting derived (E · p) data and it's analysis.


Inscrivez-vous au blog
Soyez prévenu par email des prochaines mises à jour
Rejoignez les 17 autres membres