
Les données sont bonnes, ou pas?
CoronaSTAVELOT.com
Thanks for visiting!
To translate this page, select your
language from the dropdown menu below:
Servez-vous du traducteur ci-dessus si vous préférez lire en français ( ou d'autres langues! )
When public health publishes it's most recent data, are these quite independent, or are new values simply fitting in to a repeating pattern?
Here are values for the past 10 days: new cases of COVID-19 announced in Belgium.
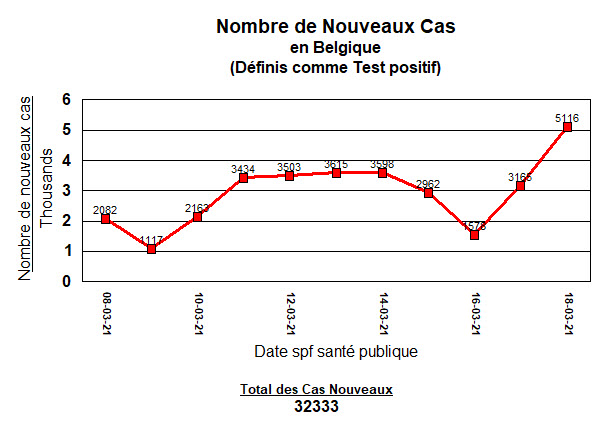
So today's announced cases are higher.
Time to sell the farm and move to antarctica, or not yet?
But is there a pattern here?
Let's look at the last 14 days ...
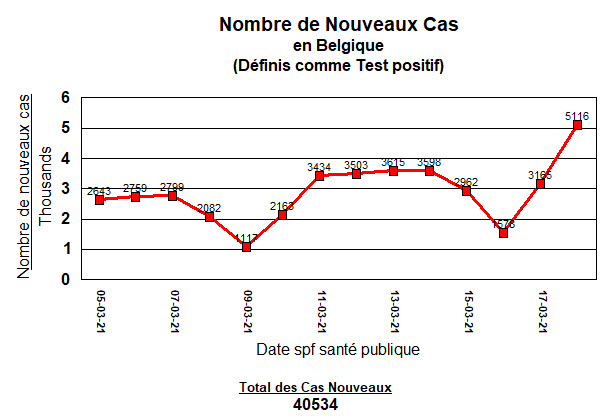
Those two low points are both Tuesdays. Does that mean anything?
Let's look at 30 days ...

Once again, all the low points are Tuesday's. And Thurdays, Fridays, Saturdays, the high points.
Then it starts over.
Clearly, the virus is checking its calendar before infecting people.
Here's a bit more. Though the point is already made visually.
Covid-19 positive tests (or cases) repeat on a weekly basis. Here's 60 days:
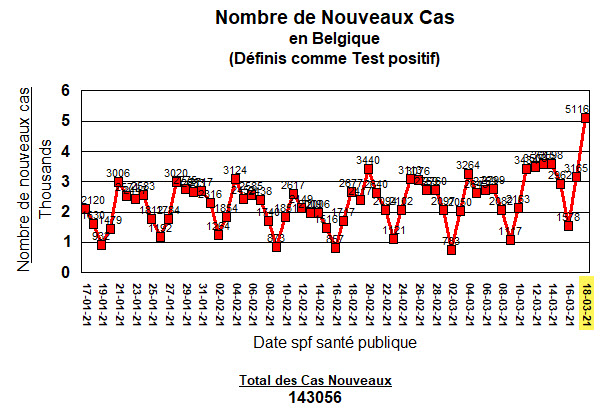
It's hard to miss the pattern. And yes, that last day is higher. I'll come back to that.
And yes, if you put a ruler across that, cases are and have been increasing.

What is the cause of this repeating pattern?
If it's not the virus with a calendar (that it doesn't have), what is it?
Some have suggested sociological factors.
People go back to work on Monday, and then cases star to rise.
They like to get together on the weekend.
Or perhaps, the habits of the country's medical system.
You call your doctor during the weekend and get the covering physician. You are told to wait until Monday. You call Monday, and get an appointment for Tuesday. ... things like that.
It actually has more to do with how your case (if you get infected) will be added to the numbers and reported by Public Health (Sciensano).
Notice that once more: it's not the virus, nor what happens with schools and at work, it's the reporting habits of Public Health. It is seen in other countries as well. Some have suggested it represents a case reporting system that is unstable.
Here below I'll quote from the experts.
These are at the American Society for Microbiology.
"Ups and Downs in COVID-19 Data may be Caused by Data Reporting Practices
- COVID-19 case and death data show regular oscillations
- New analysis of national and local numbers attributes those oscillations to data reporting practices
- Findings suggest epidemiological models should account for problems with diagnosis and reporting
Washington, DC – July 14, 2020 – As data accumulates on COVID-19 cases and deaths, researchers have observed patterns of peaks and valleys that repeat on a near-weekly basis. But understanding what's driving those patterns has remained an open question.
A study published this week in mSystems reports that those oscillations arise from variations in testing practices and data reporting, rather than from societal practices around how people are infected or treated. The findings suggest that epidemiological models of infectious disease should take problems with diagnosis and reporting into account.
“The practice of acquiring data is as important at times as the data itself,” said computational biologist Aviv Bergman, Ph.D., at the Albert Einstein College of Medicine in New York City, and microbiologist Arturo Casadevall, M.D., Ph.D., at the Johns Hopkins Bloomberg School of Public Health in Baltimore, Maryland. Bergman and Casadevall worked on the study with Yehonatan Sella, Ph.D., at Albert Einstein, and physician-scientist Peter Agre, Ph.D., at Johns Hopkins.
The study began when Agre, who co-won the 2003 Nobel Prize in Chemistry, noticed that precise weekly fluctuations in the data were clearly linked to the day of the week. “We became very suspicious,” said Bergman.
The researchers collected the total number of daily tests, positive tests, and deaths in U.S. national data over 161 days, from January through the end of June. They also collected New York City-specific data and Los Angeles-specific data from early March through late June. To better understand the oscillating patterns, they conducted a power spectrum analysis, which is a methodology for identifying different frequencies within a signal. (It’s often used in signal and image processing, but the authors believe the new work represents the first application to epidemiological data.)
The analysis pointed to a 7-day cycle in the rise and fall of national new cases, and 6.8-day and 6.9-day cycles in New York City and Los Angeles, respectively. Those oscillations are reflected in analyses that have found, for example, that the mortality rate is higher at the end of the week or on the weekend.
Alarmed by the consistency of the signal, the researchers looked for an explanation. They reported that an increase in social gatherings on the weekends was likely not a factor, since the time from exposure to the coronavirus to showing symptoms can range from 4-14 days. Previous analyses have also suggested that patients receive lower-quality care later in the week, but the new analysis didn’t support that hypothesis.
The researchers then examined reporting practices. Some areas, like New York City and Los Angeles, report deaths according to when the individual died. But national data publishes deaths according to when the death was reported—not when it occurred. In large datasets that report the date of death, rather than the date of the report, the apparent oscillations vanish. Similar discrepancies in case reporting explained the oscillations found in new case data.
The researchers emphasized that no connection exists between the number of tests and the number of cases, and that unless data reporting practices change, the oscillations will remain. “And as long as there are infected people, these oscillations, due to fluctuations in the number of tests administered and reporting, will always be observed,” said Bergman, “even if the number of cases drops.”
So what?
In case you missed it, what the experts just told us is that it is not the virus, it's not our social habits, it's not our health care system, ... but it is the way in which cases or test results are acquired and reported.
It also suggests a reporting system with a fair amount of instability: Too much variability in how data comes in, and how the quality of those data are controlled.
WIthout wanting to make this article too much longer, we recently saw (2 days ago) how 86 deaths and 10 or so resuscitated dead were added to the death count (or removed from it). These death events were as far back as last March 18, 2020. No one at Sciensano mentioned that all of these errors in reporting, every one, happened in Flanders. A year to straighten out the numbers! Disgraceful!
The number of positive cases that can't be assigned to one of the three regions of Belgium, continues to increase. (A total of 15 337 in that category today).
Also another sign of increasing instability in the counting process.
So what?
Well, when cases are at their lowest on a Tuesday, and the government begins talking about re-opening resaurants and schools: Ignore what they say.
And on a Thursday, like today, when the cases hit what looks like a new high, which the media will scream at full volume, and the government steps forward to tighten the screws: Ignore what they say.
It won't make a difference.
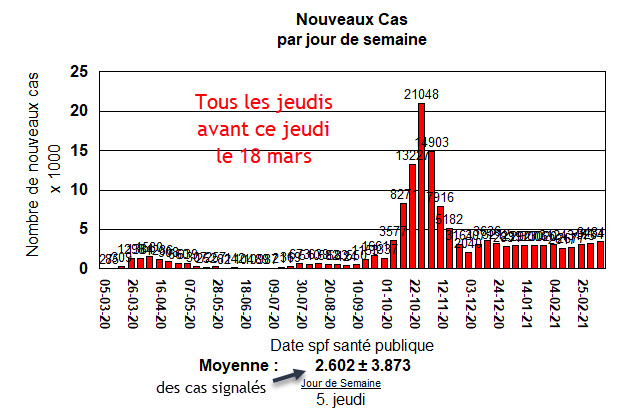
Let's look quickly at today's result with a few statistical tools.
The average number of reported cases on Thursdays before today is 2 602 cases announced.
Here is today's addition of these announced cases:
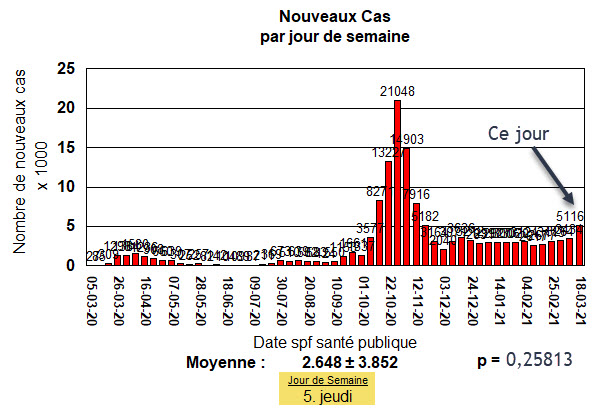
Here are some statistical tools (a Z Score and it's p-value) which tell us something:
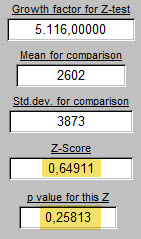

On the left above, today's 5116 cases (or positive tests) compared with the average for all the Thursdays that came before (2602 ± 3873). The Z score is a weak 0,65. The p-value says that there are 26 chances out of 100 that today's 5116 is different from the average Thursday. Statisticians say that's too high a rate of chance to accept. We'll see.
On the right, the rate of growth since yesterday (1,61642 at arrow number one) is compared at arrow number two with the average rate of growth for previous Thursdays (1,585 ± 0,441). So are present rates of viral transmission different than previously? There are 94 chances out of 100 that there is no difference: That we have seen this level of cases reported on a Thursday before.
Whatever has been done in Belgium, since the start of the pandemic, has not succeeded in reducing growth and transmission of the virus to zero. I did not say that wearing a mask, handwashing, reducing the number of contacts, etc., had no effect. Without these, cases would have certainly skyrocketed. But it has not been able to get the Belgian population to where it wants to be: no coronavirus cases. Experts will reply that that target, that challenge, is simply unobtainable. To pursue that discussion is simply more time wasting.
Why don't people see these chages, and react?
Because the changes are typically too subtle.
Day after day, only a few more cases.
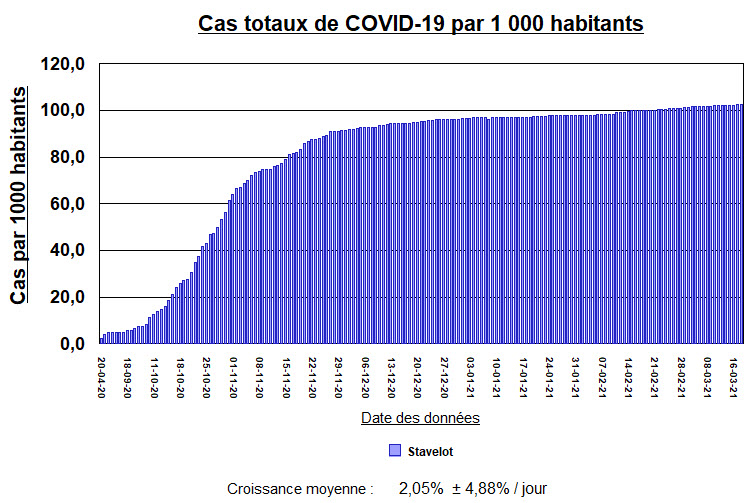
Look at the small town where I live.
Population: 7 205 inhabitants last 27 October.
Current case rate, extrapolated to a city with a population of 100 000? 55 cases.
55 cases of infection distributed in a population of 100 000 inhabitants.
That doesn't seem like much.
But it just keeps gradually sneaking higher each day (except on Tuesdays).
That looks like this:
Some will say that the above graph overstates the problem. They will say that there are now few new cases on most days. That looks like this:
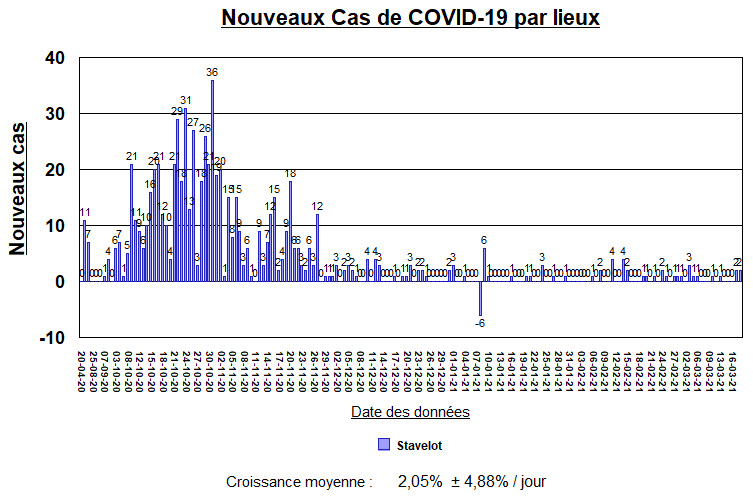
But that small trickle of cases more recently, is just enough to keep the whole thing going.
The response of the city's government has not brought infections down to a zero rate.
Is that a problem only in Stavelot?
Absolutely not.
All of the surrounding towns have exactly the same problem.

The size of the "steps" which show the gradual increase in cases from one city to the next, hasn't changed.
Not a single one has implemented a solution that puts an end to the infestation. I have been following these since last April. 14 local cities in our part of the forest, and not just these 5, but the result is the same for all.
Does a solution exist for any of these cities? : Yes.
Close the borders. Test everyone. Put all positive cases in isolation. It would take 14 days. Perhaps twice that: 28 days. Instead, all of these local towns have been waiting patiently for over a year: While their citizens wait as well, complaining more or less at various times.
No one likes the idea of the only solution possible, in the absence of vaccines.
They heard about the vaccines.
They have waited patiently for them.
But now, too many are still just waiting patiently.
Unfortunately many are already behaving as though the rumor of a vaccine is enough to scare away the virus and get back to "normal life" right now.
They are all marching to the same drum beat. And the drummer is the virus.
It decides the speed of the beat and how loudly it will be heard.
It is a much quieter drum than the sound of the dances at the Laetare.
But it never misses a beat, and it lasts longer than a single weekend.
"So what's a responsible Belgian to do?"
If you are not going to come to a deep understanding of these numbers, the best thing to do is to ignore them completely. They have not so far, and will not in the future, make a difference in getting Belgium healed.
The best thing to do is to get everyone vaccinated.
Then, when that has happened, without even knowing a single number, these case numbers will come down.
It will begin to feel different in the country. It will feel different in the streets,
It will feel different when you talk to your friends.
Anxiety will finally begin to abate.
Nothing succeeds like success.
But to get to that place, all forces must now come together. They must work together.
All efforts must be transparent and the goal is to get 0.3 mL of any vaccine available into each person's deltoid muscle. Twice for the vaccines currently available.
When the vaccine supply runs out, which it will, that can not be taken as a stopping point.
This is not a place nor a time to be patient. To hell with patience!
So far, in the first 75 days of vaccination, getting the job done has not happened.
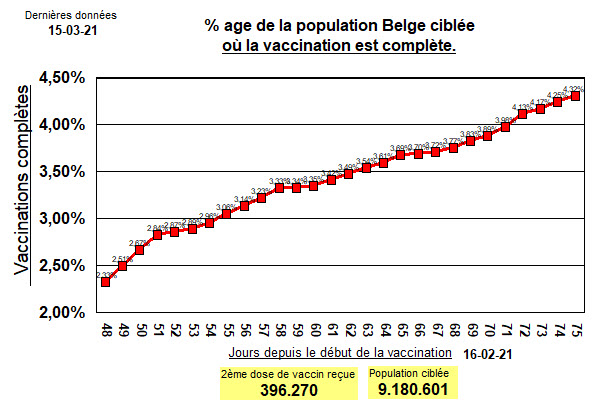
If 4.32% fully vaccinated is thought of as perhaps a nice start, it remains a totally unacceptable figure.
Ignore it. Put all efforts into doing better tomorrow and the day after that.
Pick up whatever tool you have and use it to get you and your neighbor vaccinated.
This is not a time to see if the European Union can pull together and make the right decisions for all of their member countries. As their President has openly declared, this has been another failing.
Too much administration, and trying to pinch pennies and save money looking for the cheapest vaccines to buy has created a vaccine catastrophy.
So get yourself a dose or two of any vaccine.
Yes, ANY vaccine. Waiting any longer will destroy success for everyone, including you.
You want a third wave? OK. Continue to procrastinate about this topic. Take no action.
You'll get your third wave.
If the scientific powers that be in the European Union have any neurons left at all, they will come
to that same conclusion about the Astra-Zeneca vaccine. We are waiting their erudite opinion this day.
Use it all up. Use the Astra-Zeneca vaccine on whoever presents for it. And all should present for it.
Q: "Are you sure?"
Answer: "Yes. I'm very damn sure."
No one wants to be the rare person who gets a clot in his or her cerebral vein and has a stroke.
But no one wants to be that rare person who dies on a ventilator after a month in the ICU in Liège or Antwerp or Bastogne from a coronavirus infection. The whole process of getting sick with coronavirus infections includes a common finding of thrombosis of small and large blood vessels throughout the body.
Q: "Would you rather get a clot from the vaccine (much less common) or from the viral illness itself when you get it? (much more likely)."
Right Answer: "I don't want to get it from either one."
Rare events, though rare, do happen.
Those who have lived, worked and breathed in Medicine learned that the hard way.
It's not what you know that will kill your patient. It's what you don't know.
And for those who worked very hard to learn everything required to save lives, that lesson is learned with difficulty each time. Always accompanied by much pain. Those cases are never forgotten. They are taken by Nurses and Doctors into their retirement and beyond. They are never forgotten.
But even so, most of those who get treated do survive.
"Praise the Lord, and pass the ammunition."
And so we pick up and get on with it.
Most who get coronavirus infection: survive
Most who get the vaccine for the coronavirus: survive.
Overall, complications from either, including death, are rare but always impressive.
And the media will spread it around like suntan lotion at the beach.
Most who will be vaccinated will have nothing to tell about it but the inconvenience of the wait.
Figuring out what effect variants of the virus will have on viral transmission is too complicated and unknown a scientific problem to give an answer right now.
Don't strain your neurons trying to figure it out.
Go get 0.3mL in either deltoid muscle.
To get picky and choosey about which vaccine you will accept, is an insult to those who worked day and night, and all the weekends, to bring you this great gift and prove its safety. Accept it thankfully.
When the system of appointments for vaccinations breaks down: Yell and scream about it!
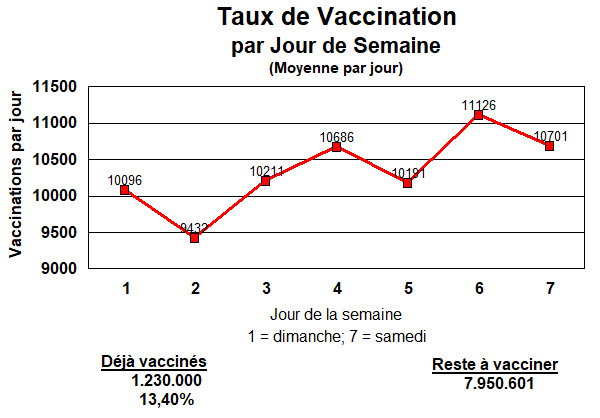
When no one wants to show up on a Monday to be vaccinated: Yell and scream about it!
When large vaccination centers are empty, that is a disgrace: Yell and scream about it!
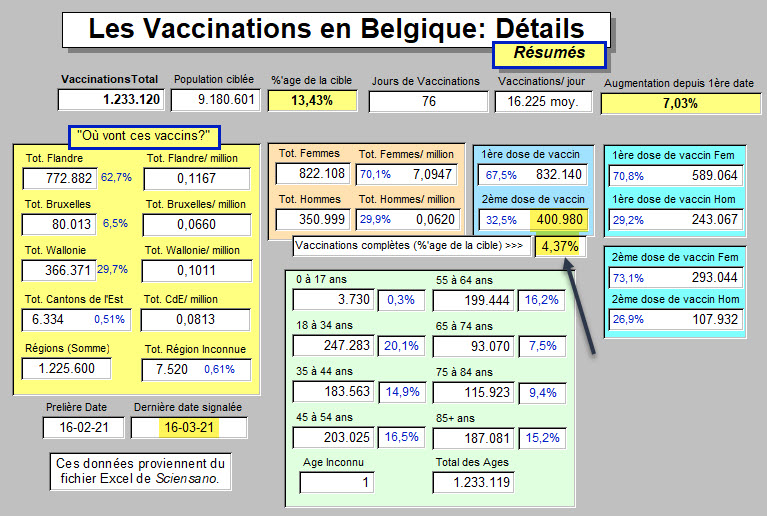
When there are more women being vaccinated than men, come together: Yell and scream about it!
When one region of Belgium gets more people vaccinated than another: Yell and scream about it!
When the current rate of vaccination predicts that vaccinations will be complete May 20 of 2023: Yell and scream about it!
When the newspaper or television callously scares everyone to death with another report of someone with a clot that formed somewhere, or some other complication, doing that is wrong. It's practicing Medicine without a license: Yell and scream about it!

Here are today's figures:
This is not a time to listen to voices giving detailed explanations about how Belgium got into this mess.
This is not a time to listen to voices predicting a third wave of cases and arguing about the details of why, when, and how many cases there will be, and whether France or Belgium is out in the lead of cases and deaths. Tell those people: "I don't care. Give me a shot of vaccine, and be quiet."
It is time to put people with flasks of vaccine, and the equipment required to give it, on every street corner of Belgium until everyone has had the doses required.
Do what you must, but get 0.3 mL (0.5 mL for some) of any available coronaviirus vaccine in your muscle.
Then, while keeping your mask on, walk away with a smile.


Inscrivez-vous au blog
Soyez prévenu par email des prochaines mises à jour
Rejoignez les 17 autres membres