
The Billy Plan Today - 4 Nov., 2020
CoronaSTAVELOT.com
Thanks for visiting!
To translate this page, select your
language from the dropdown menu below:
Servez-vous du traducteur ci-dessus si besoin ...
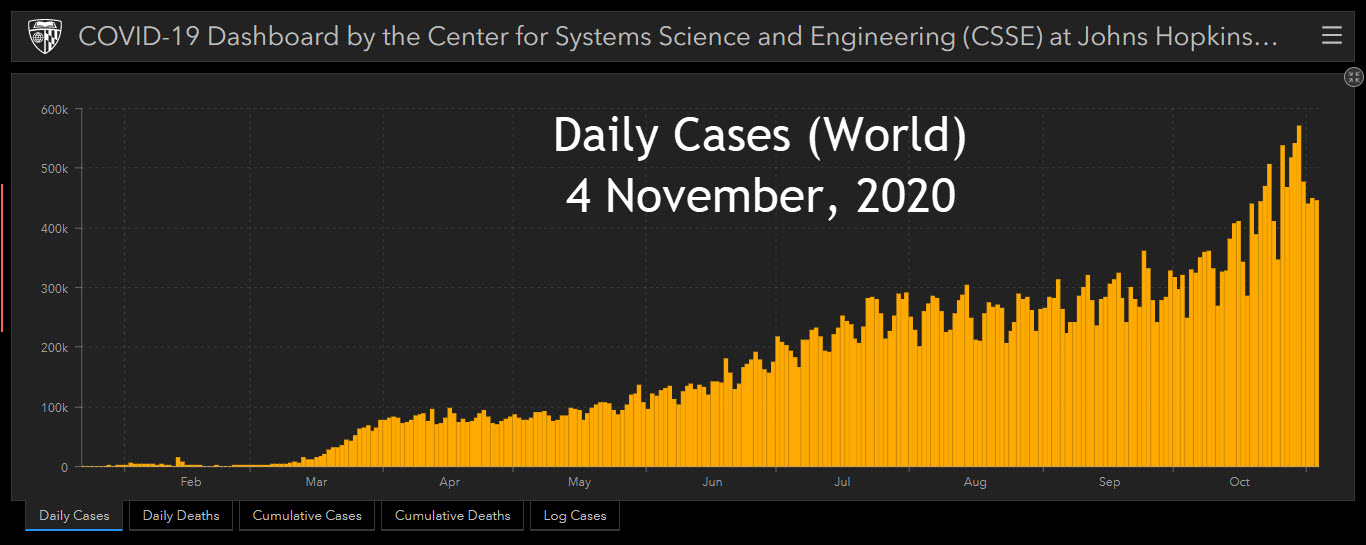
The WORLD
A diminution in those actively ill in the World.

Is this a point that we'd all like to see?
BELGIUM - Cases
This looks good ...
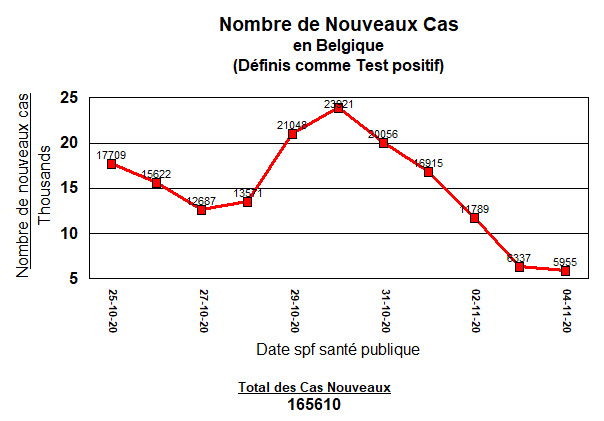
But it depends on where you look in Belgium.
The trend in new cases is downwards, but the Walloon region continues to lead the others in new cases each day.

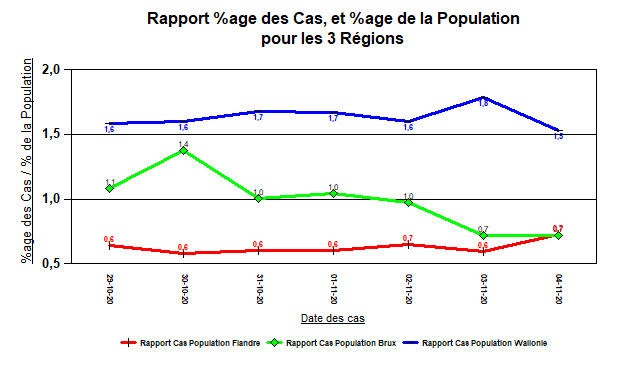
This is % of new cases, divided by the % of the population inhabiting a region.
The Walloon region again leads the other two.
On a positive note today, a Wednesday, fewer cases were presented than last Wednesday.
But by comparison with numbers of cases during the "first wave" as many here like to call it, numbers have been higher for 5 or 6 weeks.
But a new government was still attracting much attention to things much more important than cases of viral illness.
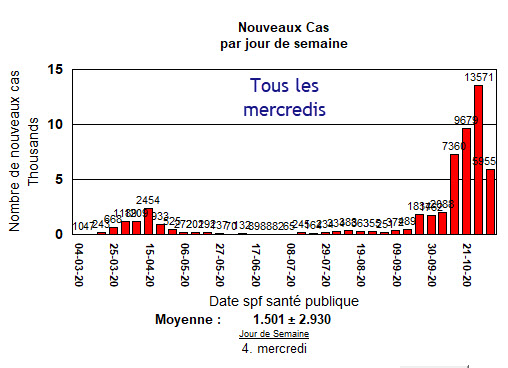
So today was still high (5 955 new cases) but lower than last Wednesday (13 571). Good.
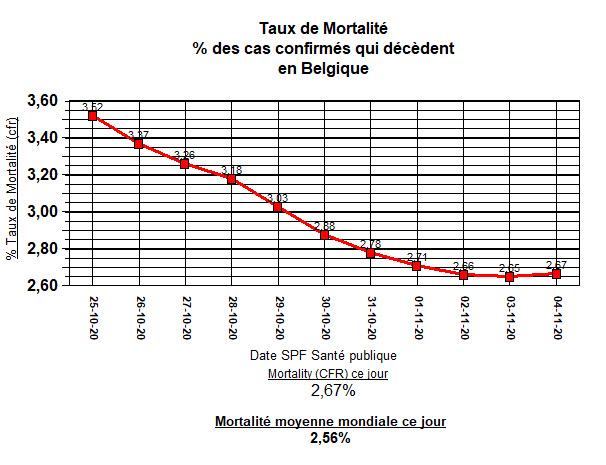
BELGIUM - Deaths
The Death Rate (or Case Fatality Rate, (2.67% today)) is going down, closely paralleling that value in the World (2.67%).
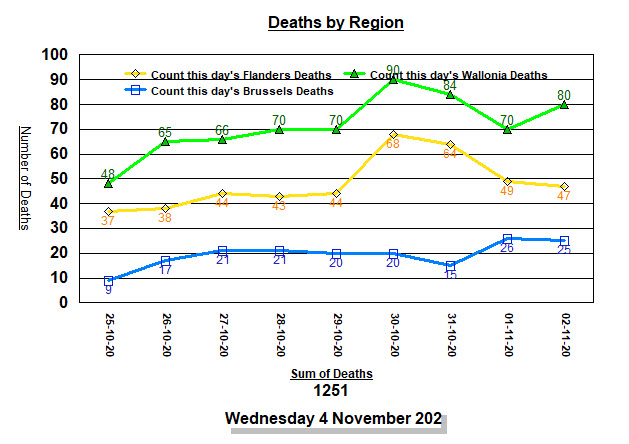
Nevertheless, deaths are increasing at the present time in all regions of the country.
Once again, Wallonia leads the others in deaths announced each day.
14 LOCAL CITIES
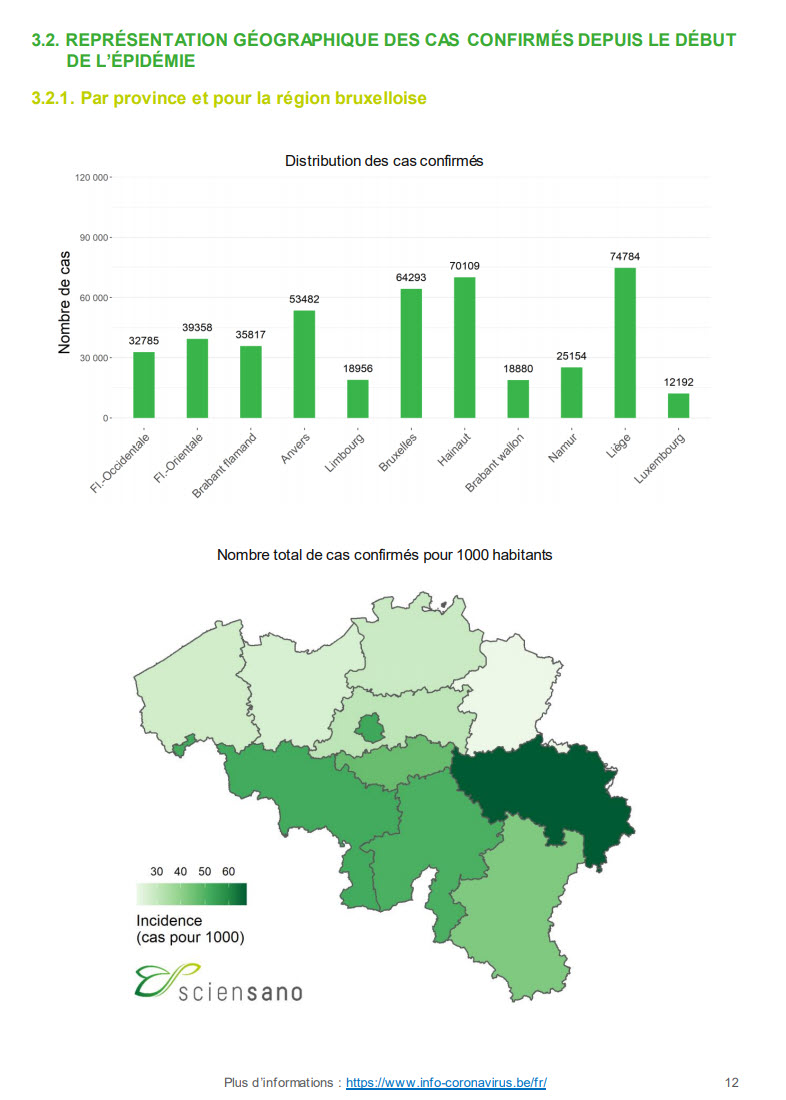
Let's first look at Cases by Region, since the 14 cities we have been following are in the Liège Province that leads as well in incidence of new cases. (It's the fish-shaped dark green region below).
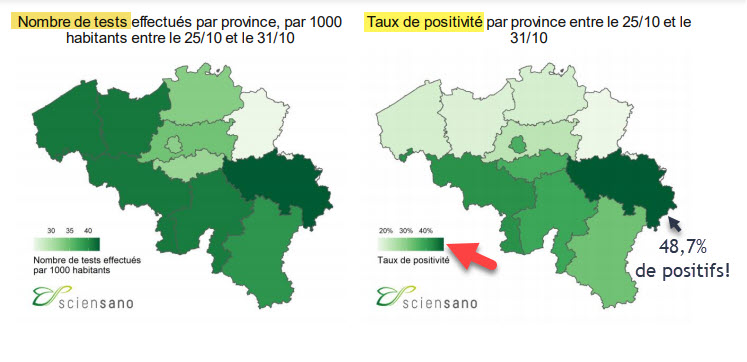
Matched to that is the highest test positivity rate in Liège Province.
When Mexico's positivity rate passed 40%, the world had a hard time believing the figure.
There just couldn't be as much viral illness in one country as that number suggested.
These data presented graphically below suggest that the greatest number of tests for the SARS-CoV-2 virus, are being done in this province. Good. But it currently has a 48.7% test positivity rate!
That's bad.
The Trend in Cities Nearby

Is a rounding of the rate of rise at the top of this graph, beginning to appear?
5 small neighboring towns, where perhaps in the last 2 days a slowing of the increase in cases is trying to show itself.
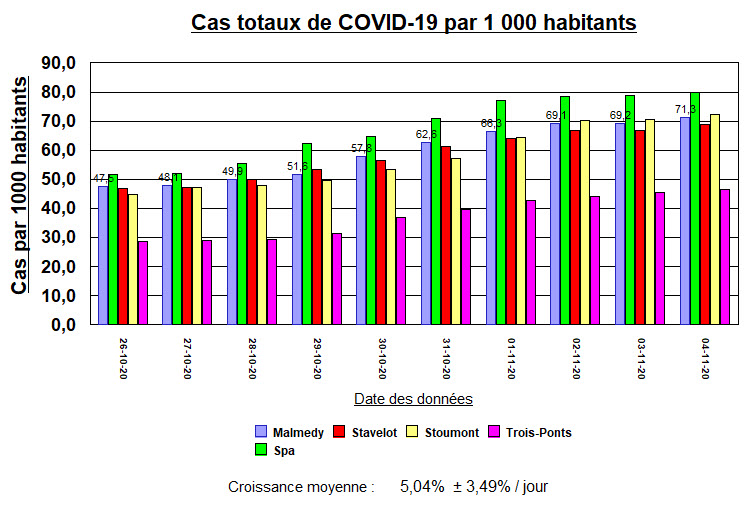
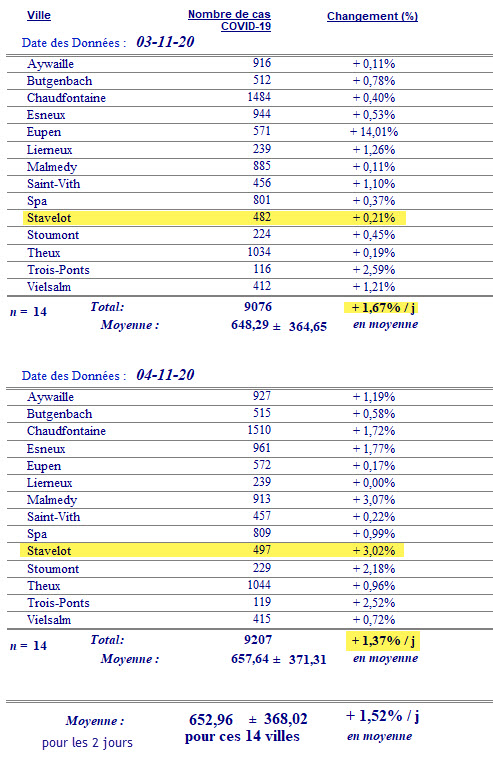
While cases in Stavelot increased, overall for the 14 cites taken together, a very slight decrease in growth rate of cases is present. Not much change. We'll see tomorrow.
Are cases increasing, but at a slower rate? Perhaps.
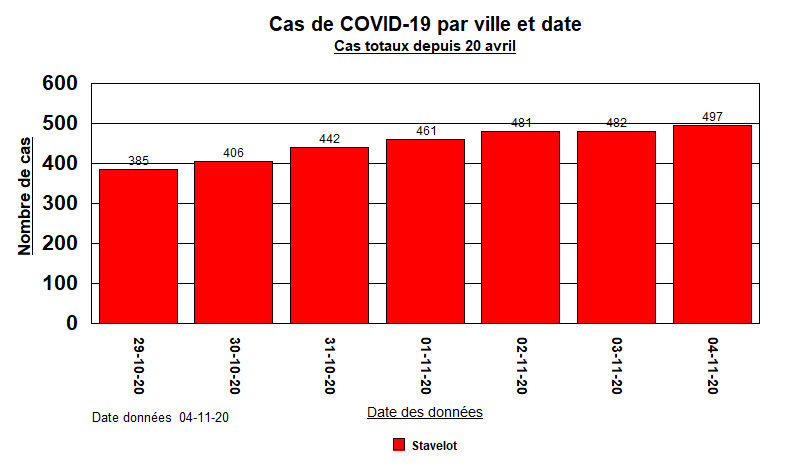
Closing in on Stavelot ...
As mentioned yesterday, the "Tuesday effect" of fewer cases nationally, is also evident in Stavelot.
Nothing to do with the virus. It's due to the testing and medical practice habits.

Case numbers in Stavelot in the last 7 days ...
Any help to be had from statistical control of these data? Perhaps.
We've been applying two models to the results each day. One is exponential. The other is linear.
Exponential becomes a rocket one day. Linear just plods along. Both in Stavelot are increasing.
Without pushing too hard here with the details, the exponential model's error in prediction is increasing day after day.
The linear model's error is diminishing. Today it correctly predicted the number of cases announced.

So what?
Well one would like to have the actual results in Stavelot, not come out of the column of the exponential model above. It suggests that if things continue as they have been, everyone in town will have been infected by December 8.
So we prefer to listen to the linear model.
Both models suggest that new cases will increase. It's just a question of differences in velocity.
Any other evidence to support the linear prediction?
Don't be afraid of the numbers below, I'll quickly explain.
These are comparisons of sequential 10 day periods of reported cases.
In each, with the dates given, an average rate of growth is given with its standard deviation to permit comparing these mean values. It's called Student's unpaired t-test. You can forget that.
At number 1, growth rate was high in the first 10 day period and lower in the second.
The p-value informs that these periods of growth were probably different.
Next, at number 2 ...
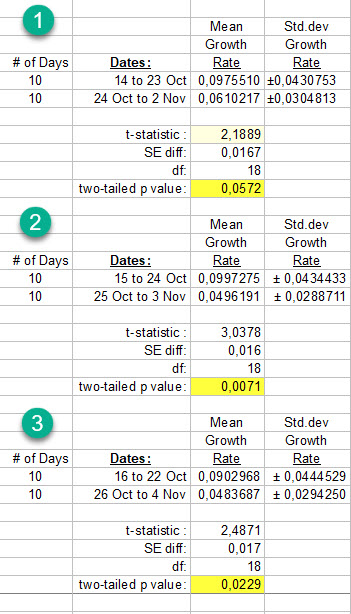
At Number 2, in the first period of 10 days the growth had increased even more, then diminished importantly in the following 10 days.
A p-value of 0.0071 says that a big difference existed in the rate of growth of cases in these two 10 day periods that followed each other.
This is probably where what had actually been an exponential growth rate, now became linear. Calmer if you like, though still growing.
At green Number 3, the growth rate in the 1st 10 days has decreased from that in the other periods (at green numbers 1 & 2). The difference with the 25 Oct to 4 Nov group of 10 days is still significant (p = 0.023), but less impressive than before. These last two 10-day periods are starting to get closer together in terms of rate of increase in cases.
That supports the idea of a still ongoing transition from exponential to linear growth. Good.
But let's not get cavalier.
Here's a different approach to underlining that this is still serious business.
Stavelot is a small town. Let's compare it with a bigger town...
In England Boris Johnson, Prime Minister, decided to test everyone, all inhabitants, sick or not, in the city of Liverpool.
Why? Because Liverpool had the highest number of cases in England last week.
Liverpool reported over 410 weekly cases per 100 000 inhabitants. This will be the first city in England to be tested on a city-wide scale. Approxilately a half million people live in Liverpool. They were probably impressed by what the population did in Slovakia to test everyone.
So Liverpool had 4100 cases per million population, or 2050 per half-million that live there, last week.
It is one of the highest numbers in the United Kingdom.
Everyone working or living in the city will be offered tests, even if they are asymptomatic.
As Boris Johnson said: "These tests will help identify the many thousands of people in the city who don’t have symptoms but can still infect others without knowing,”
Let's play with a few numbers, and put that into perspective with Stavelot.
If one adds from one day to the next, the cases per 1000, for the past week in Stavelot, that equals a sum of 418.5 cases per 1000 inhabitants.
If one sums not the total cases, but the new cases per 1000 each day in Stavelot during the past 7 days, that's 19.25 new cases per 1000 inhabitants. That may not seem like much.
But if one extrapolates that to a population of 100 000, as reported for Liverpool, it equals 1925 cases per 100 000 inhabitants. Some may suggest that it's silly to do such a magnification, because Stavelot doesn't have 100 000 inhabitants.
So in Liverpool, for a level of proven infection of 410 weekly cases per 100 000, mass testing is being rapidly embarked upon.
In Stavelot, for the equivalent of 1 925 weekly cases per 100 000, mass testing is not being embarked upon. For all of Belgium, 906 per 100 000 last week, and 1774,4 per 100 000 the last 2 weeks. Stavelot beats the rest of the country.
And in fact, the policy in Belgium of only testing those with symptoms is still being carefully and strictly followed. That, while people with no symptoms at all, spread the disease to others in Stavelot.
Faced with a rate of infection in Stavelot that is 4.7 times the level of infection in Liverpool, it seems that we are all calmy waiting for this problem to go away. If the mathematical indices explained above suggest a possible calming effect of this storm, and I sincerely hope so, this is not the moment to wait and simply accept to remain locked up and inactive.
People are waiting for a vaccine with all of its remaining uncertainties of safety, effectiveness and deliverability. The newspapers never miss mentionning that volunteers in Belgium are being vaccinated to test several vaccines and see which is best. They had best hurry.
While current restrictions no longer permit going to Church and praying with others for salvation from this local crisis, it would seem that prayer may be the best solution at this time in Stavelot.
But instead of going to the Church of Saint Sebastian here in Stavelot, just stay home to intone the well known words and pray for the best.
----------
Yesterday, Nov 3, 2020 >>>>>>>>>>
<<<<<<< The Billy Plan - Index to related articles


Inscrivez-vous au blog
Soyez prévenu par email des prochaines mises à jour
Rejoignez les 15 autres membres