The Billy Plan Today - 3 Nov., 2020 - When numbers are a trap
CoronaSTAVELOT.com
Thanks for visiting!
To translate this page, select your
language from the dropdown menu below:
Servez- vous du traducteur ci-dessus.
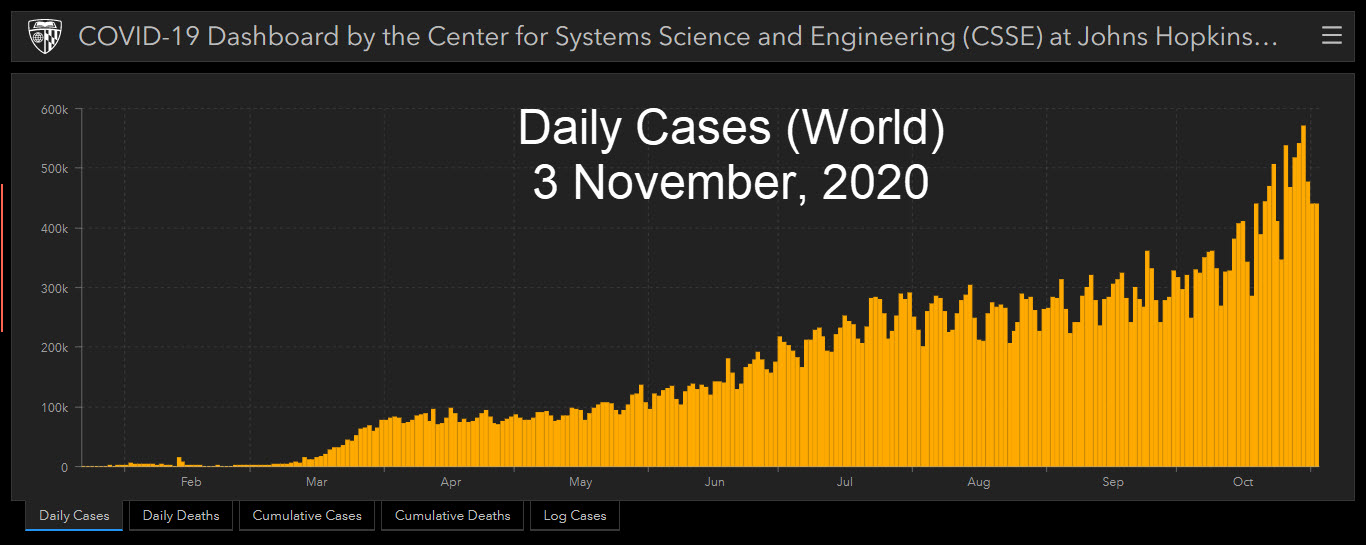
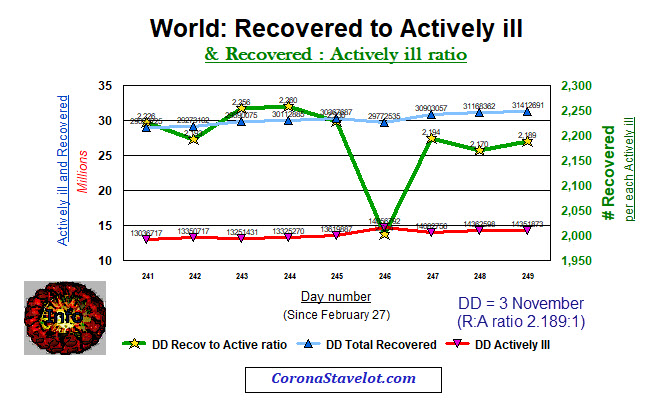
The WORLD
The end of the curve present a possibility of improvement. Death rate diminishing and more Recovered this day when compared with those still Actively iLL. (2.189 recovered for each actively ill).
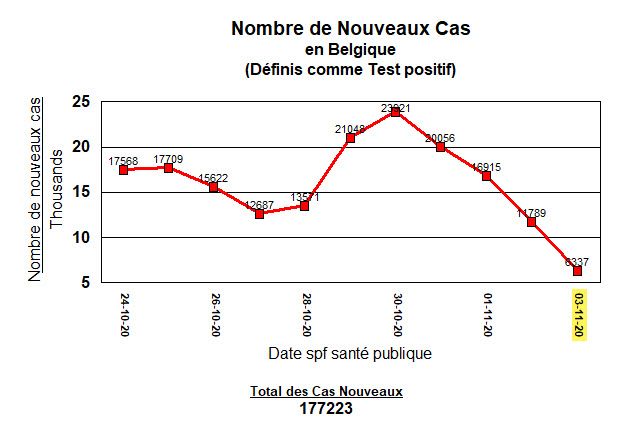
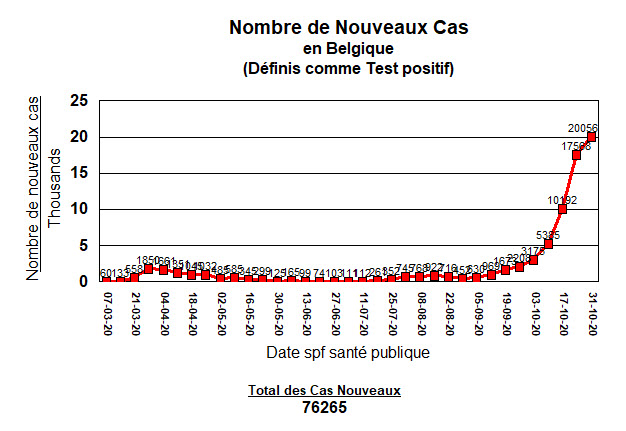
BELGIUM - Cases
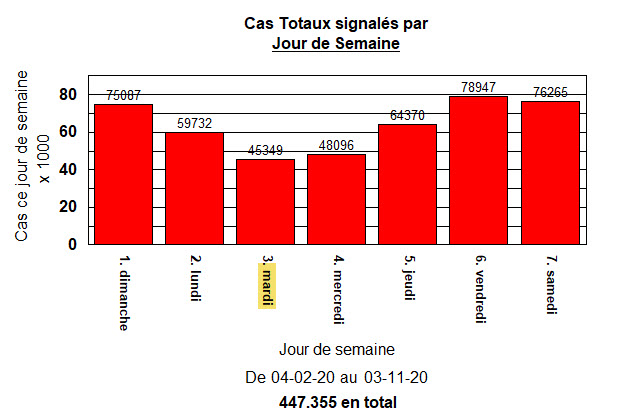
It remains essential to place daily changes in the context of the average number of Total Cases by day of the week.
We are Tuesday.
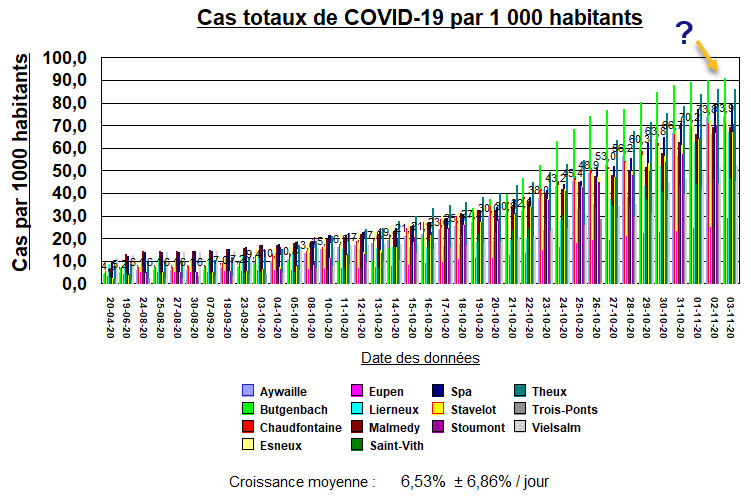
14 LOCAL CITIES
Does this "cases by day of week" effect pass down to individual cities?
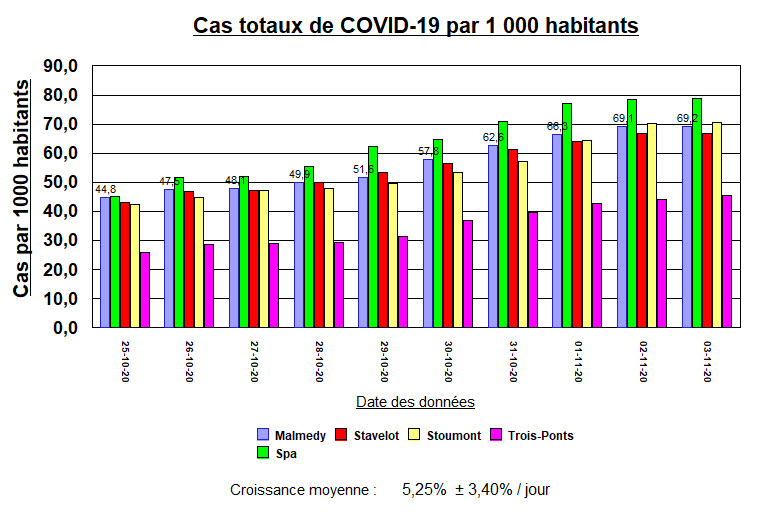
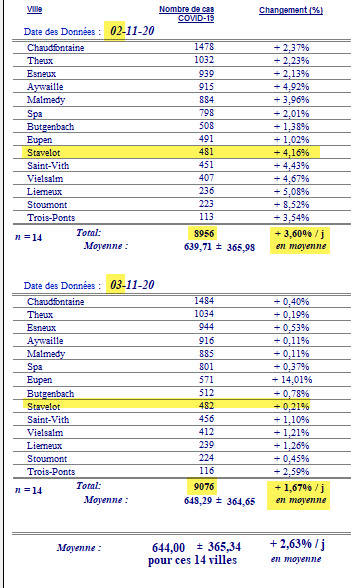
Is this the start of a hoped for positive change?
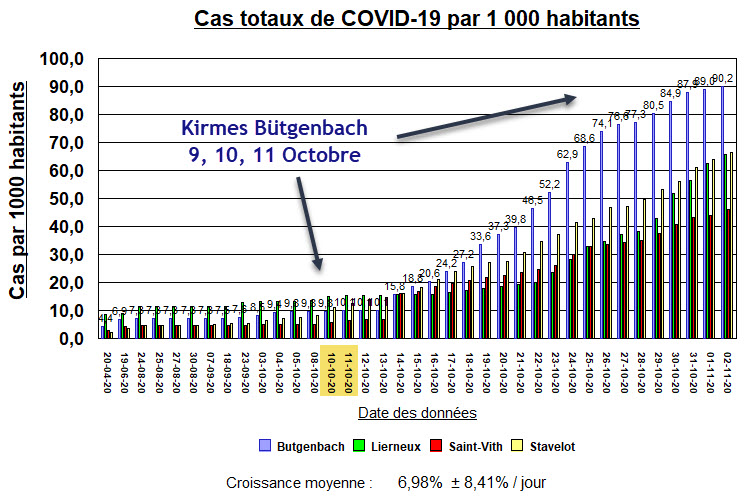
Is it hinted at for these 5 neighboring cities ?
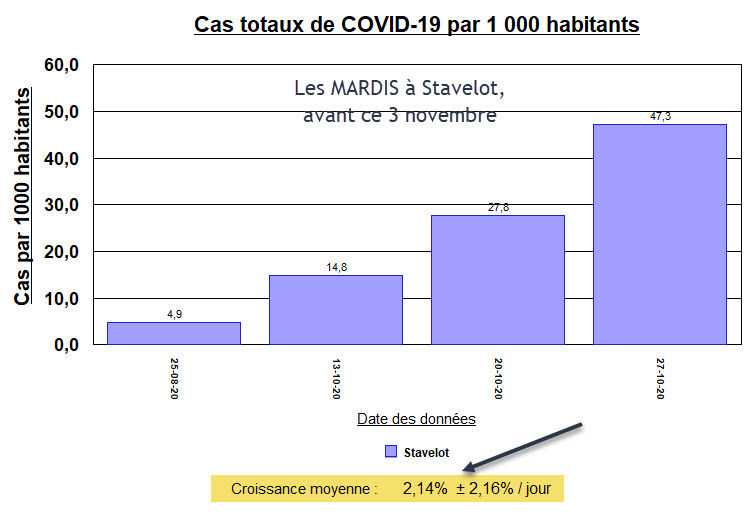
Let's compare two days of the week in Stavelot. Tuesdays and Fridays recently.
Here are the last 4 Tuesdays before today.
The Total Case numbers increase 2.2% from one to the next.
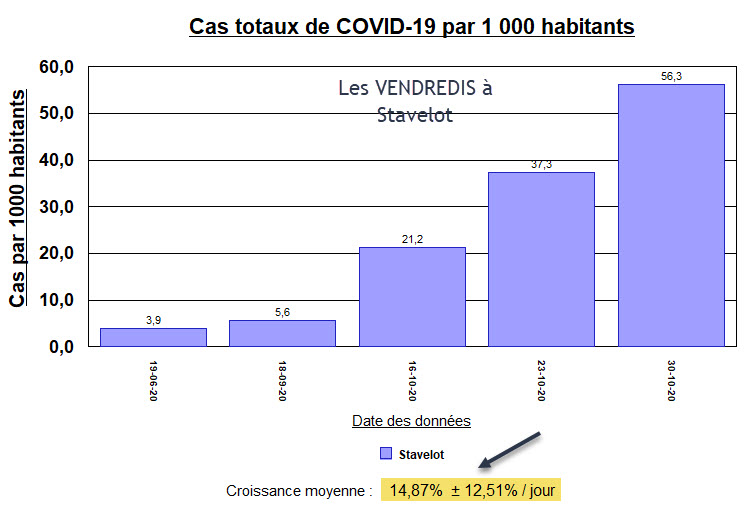
Here are the last 5 Fridays :
These Friadays show an average growth rate in Total Cases in Stavelot of 14.8%.
So even in Stavelot, there is a "day of week" effect.
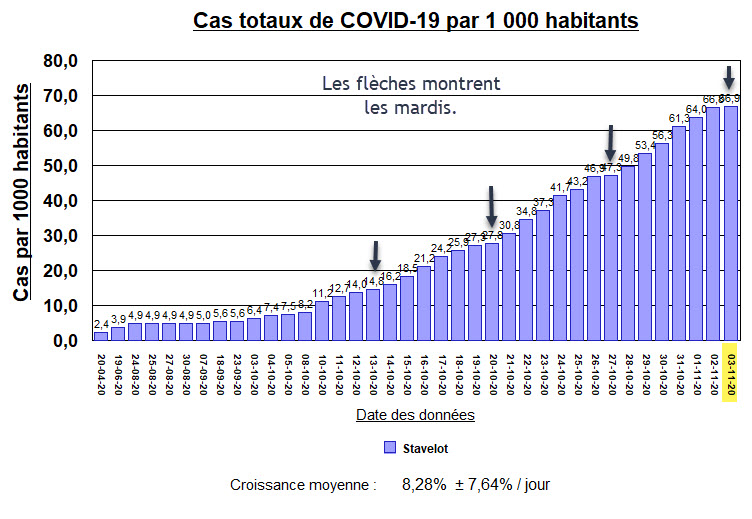
One can also get a sense of Tuesdays bringing a plateau to growth in the graphic below.
The arrows show the Tuesdays. The Monday before is usually just a bit lower. Less change on Tuesdays.
But before we become too pessimistic, are there any positive signs?
Yes. Here's one.
But we quickly accept that yesterday was Monday, and today is Tuesday, so maybe it's just more of that "day of week" effect.
But let's not abandon too quickly.
Unfortuantely ...
We need a few statistics to add a little clarity if not brevity.
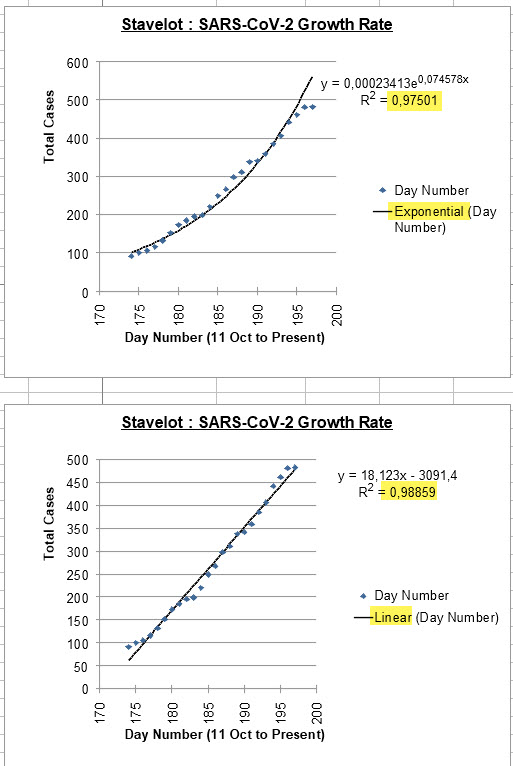
Below, the relationships between passage of days and Total Cases that we have presented before.
On top, an exponential relationship. This is the relationship that stays quiet until it goes off like a rocket.
The relationship is still strong (R²=0.975) but it weakened just a bit in the past two days.
One also notices some points of actual values that are falling below the line.
Below this one is the linear relationship. Its correlation value, R² = 0.9886, is now slightly higher than the one for the exponential relationship.
The points are also staying closer to the line which is a good sign.
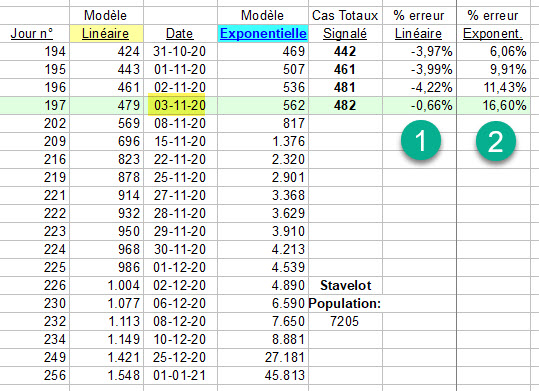
Let's let these two predict some outcomes. That looks like this:
Today is Day Number 197, or 3 November.
There were 482 Total Cases announced for Stavelot.
The exponential relationship predicted 562. That's a 17% error.
The linear realtionship predicted 479. That's two cases below actual. That's less than a 1% error.
The large green number 1 shows that the error has recently been smaller for the linear than for the exponential relationship (green number 2).
The linear relationship is certainly the rate of growth in cases that we would prefer if we had to chose between the two.
Just a little more ...
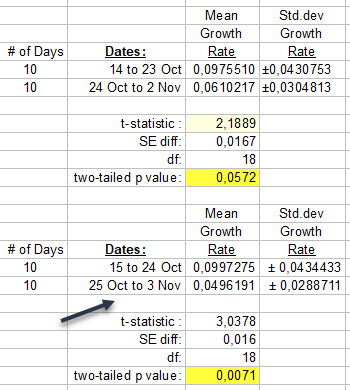
A comparison of two periods of 10 days of growth in these total positive tests for infection.
These two groups of ten are actually only 1 day apart if you look closely.
But maybe there's actually no difference in these pairs of average numbers?
That is called the null hypothesis.
Without belaboring the point, that hypothesis of no difference does not seem to be a correct conclusion.
In fact even more than when calculated yesterday, the last 10 days have a smaller average rate of growth in cases (4.96%) than the previous 10 days (9.97%).
What is the chance that there actually is no difference in growth? Yesterday in was 57 chances out of 1000. Today, it's 7 chances out of 1000 that what looks like an improvement is not one at all, but just a coincidence.
If there were 993 chances out of 1000 that I would win my bet, I might quickly place a few €uros on the table. Certainly 5 or 10 €uros if i had them in my pocket.
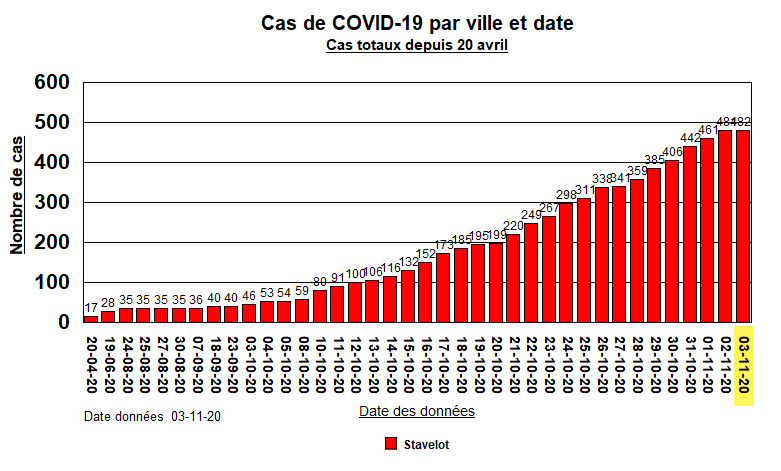
So when one looks at the graph below and sees that in Stavelot, with only 1 case more since yesterday, perhaps we've reached the peak, do not lose that hope of good things to come.
But it still remains wise to prepare for the possibility of the opposite result as well.
It's much too early of course to explain any positive change in the last few days, by the recent increase in limits imposed by the government. They just started officially yesterday.
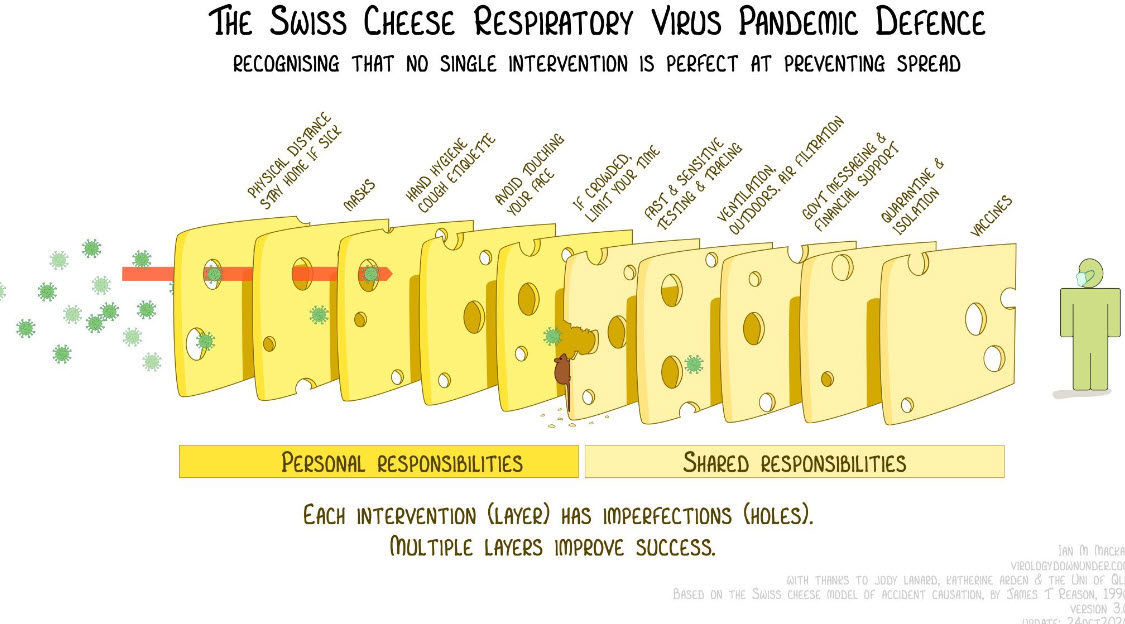
But we should take this opportunity to remind that success will only come through a combined effect of personal and shared responsibilities. There are holes in the cheese, but they rarely go all the way through. It's not about doing one or two things that are required. It's about doing all the things that we can, and that can make a difference.
And unfortuantely, we saw that little vacations from caution over a weekend, just won't help today's suggested improvement to prove itself as real in the days to come.
An attitude of just getting by, tolerating a few cases here and there, while awaiting the arrival of the vaccine, ... Well, that just didn't work.
Test asymptomaic citizens. Quarantine the positives (but not where they can infect family members). Close the borders of Stavelot to all potential cases being delivered here from elsewhere. Then real progress towards safety can be made.
And control of rising case numbers doesn't have to wait until a vaccine appears.
Look at all the trouble most people (or their neighbors) are having to obtain the influenza vaccine. Something that has been an ongoing process available for years, has now become a complicated mystery for the 35 to 40% of the population who get it each year.
Do not behave as though a vaccine for SARS-CoV-2 will be available any time soon.
Do everything that you can to protect the nice town where you live.
<<<<<<< The Billy Plan - Index to related articles
Inscrivez-vous au blog
Soyez prévenu par email des prochaines mises à jour
Rejoignez les 15 autres membres

